
Heavy metals in food database
Which foods contain how much mercury, arsenic, cadmium and lead, and how governments and international bodies assess them — listed using only figures from government agencies, laws and papers. We show levels by food, limits in Japan, Codex and the EU, tolerable intakes, and 50 years of intake in Japan. We do not call anything “dangerous” or “safe”; we set out the numbers and their limits.

What we know now
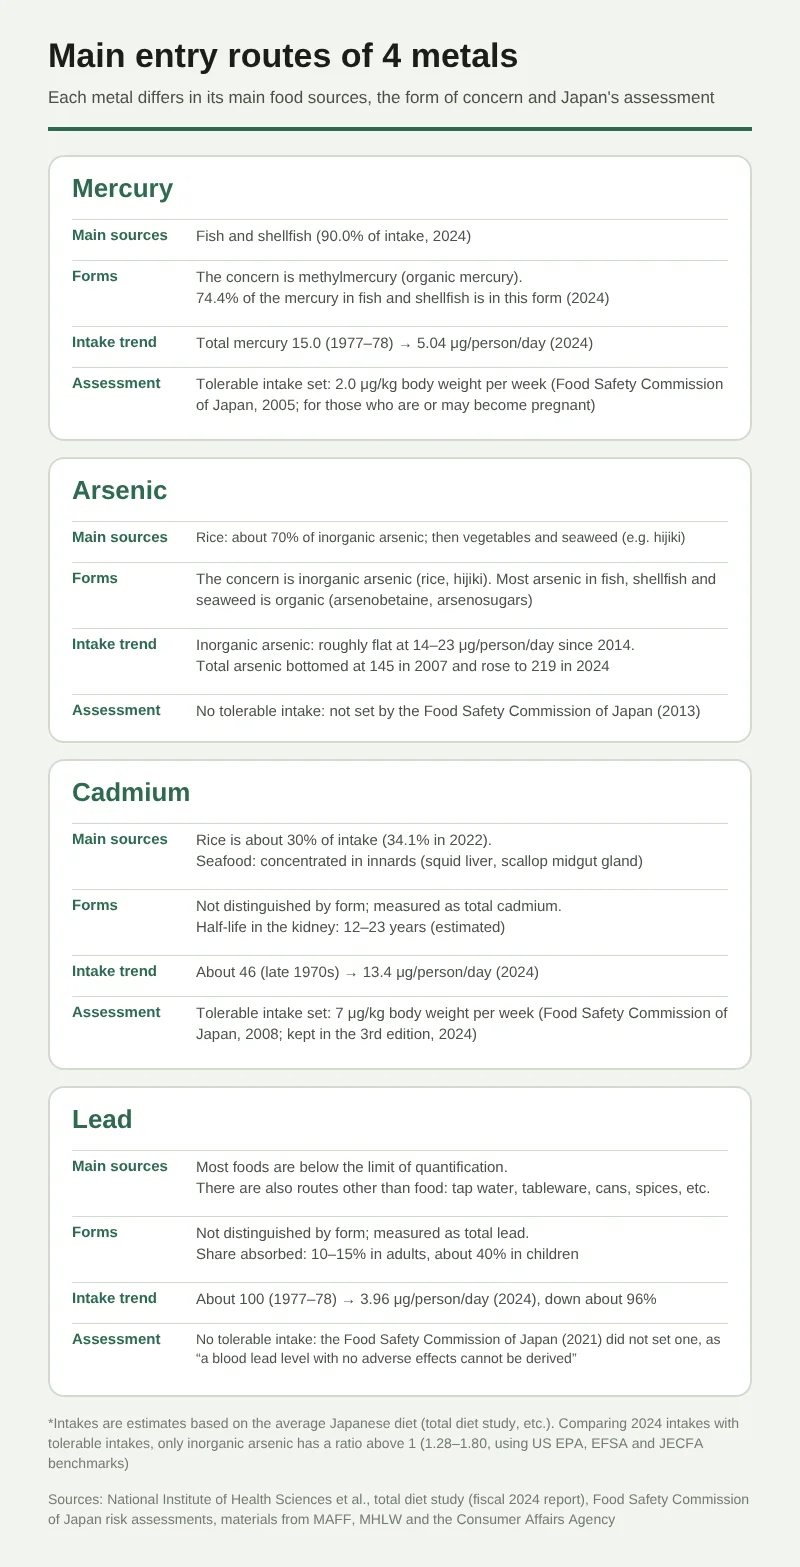
- Intake from the Japanese diet has fallen in surveys since 1977. Lead is down about 96% (about 100 → about 4 μg/person/day), cadmium is less than half, and total mercury about a third (15.0 → 5.04 μg/person/day). Total arsenic has risen since 2007, while inorganic arsenic is roughly flat (50 years of heavy-metal intake in Japan).
- Each metal has different main sources. Mercury comes from fish and shellfish (90.0% of intake), inorganic arsenic from rice (about 70%) and hijiki, cadmium from rice (about 30%) and the innards of shellfish. Most foods are below the limit of quantification for lead, which also enters through non-food routes such as tap water, tableware, cans and spices.
- Comparing 2024 intake with tolerable intakes, only inorganic arsenic has a ratio above 1 (1.28–1.80). But the Food Safety Commission of Japan has not set a tolerable intake for inorganic arsenic or lead, so the conclusion depends on which yardstick you use.
Reading the numbers
- Check the form and state. Total vs inorganic arsenic, total mercury vs methylmercury, and dried vs soaked hijiki can differ by an order of magnitude. Levels are in mg/kg (= ppm) wet weight; anything else is noted.
- A limit is not a line between safe and dangerous. Where Japan has no limit, a food cannot be said to “exceed” it, and tolerable intakes rest on different evidence at each body (for mercury, 3.4 to 1.3 μg/kg per week). The same intake can look like 29% or 81% depending on the yardstick (How limits differ in Japan and abroad).
- Survey years and sample numbers are limited. Mercury in fish is a compilation up to fiscal 2008, cadmium in shellfish comes from surveys in fiscal 1997–2002, and foods with only a few samples have unstable averages. Where we found no Japanese government data, we show no number and say so.
Common questions
Only what government documents and papers show
By metal
Forms, effects on the body, tolerable intakes, intake in Japan and history
Levels by food
Tap a name for measured levels, limits and ways to reduce intake at home
Fish11 items
Large fish high in the food chain, such as tuna, marlin and alfonsino, carry the most methylmercury
- Pacific bluefin tuna (hon-maguro) and southern bluefin tunaMercury is in the higher group among fish. Guidance for pregnant women: Pacific bluefin up to once a week, southern bluefin up to twice a week
- Bigeye tuna (mebachi)National guidance is up to once a week (same as Pacific bluefin). Average methylmercury is 0.539 ppm (national compilation)
- Yellowfin tuna (kihada), albacore (bincho), and young Pacific bluefin (meji)Tunas that the national guidance says can be eaten “as usual.” However, the figures vary from survey to survey
- Canned tunaMercury is low, at an average of 0.110 ppm, and the national guidance says it can be eaten as usual. However, we found no survey by source fish species
- Skipjack tuna (katsuo)Mercury is low. It is not in the national table of guidance amounts, and it is also the source fish for light canned tuna. We found no official arsenic figures
- Swordfish (mekajiki) and striped marlin (makajiki)National guidance: swordfish up to once a week, striped marlin up to twice a week. Swordfish mercury averages 1.003 ppm
- Splendid alfonsino (kinmedai)National guidance is up to once a week. A deep-sea fish, exempt from the provisional regulatory limit. Average methylmercury is 0.535 ppm
- Whales and dolphinsMercury is orders of magnitude higher in some toothed whales. Bottlenose dolphin: up to once every two months. Baleen whales are low
- Salmon (sake)Mercury is low. It is not in the national table of guidance amounts, and US advice also lists it as a fish to eat 2–3 times a week
- Mackerel (saba)Mercury is on the low side. Total arsenic is high, but most of it is the organic arsenic common in fish. Not in the national table of guidance amounts
- Sardines, horse mackerel, and Pacific saury (iwashi, aji, sanma)Mercury is low. Total arsenic is high but inorganic arsenic is small. Sardines had a higher share of dimethylarsinic acid
Shellfish, squid and crab3 items
The flesh is low; cadmium collects in the innards (scallop hepatopancreas, squid liver, crab “miso”)
- Squid and shiokara (salted, fermented squid)The flesh is low and the innards are extremely high. Squid shiokara averages 2.63 ppm cadmium (maximum 9.9)
- Scallop, oyster, abalone, and turban shell (hotate, kaki, awabi, sazae)The innards are much higher than the flesh. Scallop “uro” averages 33 ppm and the adductor muscle 0.45 ppm (fiscal 2010)
- Crab and crab innards (“kani miso”)The flesh (muscle) is on the low side and the crab innards (kani miso) are high. Red snow crab innards average 11.74 ppm
Seaweed4 items
Hijiki is high in inorganic arsenic. Most arsenic in kombu, wakame and nori is organic
- Hijiki (a brown seaweed)Dried hijiki averages 67 mg/kg inorganic arsenic. Soaking cuts it by about half and soaking then boiling in fresh water by about 90%. Advice differs by country
- Kombu (kelp)Total arsenic is high at an average of 53 mg/kg, but inorganic arsenic was below the limit of quantification (0.5) in all 100 samples tested
- WakameTotal arsenic is 33 mg/kg on average, but inorganic arsenic was below the limit of quantification (0.5) in all 100 samples tested
- Nori (dried laver)Total arsenic is 25 mg/kg on average, but inorganic arsenic was below the limit of quantification (0.5) in all 100 samples tested
Rice, grains and beans4 items
Rice is the largest source of inorganic arsenic and cadmium in the Japanese diet
- Polished (white) rice (hakumai)Inorganic arsenic in domestic polished rice averages 0.09 mg/kg. The cadmium standard is 0.4. Levels have been falling year by year
- Brown rice (genmai)Inorganic arsenic in domestic brown rice averages 0.13 mg/kg. It is higher than in polished rice and barely falls with washing
- Wheat (komugi)Cadmium in domestic wheat averages 0.05 mg/kg (max 0.50). Most arsenic and lead results are below the limit of quantification
- Soybeans (daizu)Cadmium in domestic soybeans averages 0.11 mg/kg (max 0.87). A somewhat higher agricultural product than rice or wheat
Vegetables, tubers and tea3 items
Mostly low, near the limit of quantification. Differs by part, such as peel or tea leaves
- Spinach (hourensou)Cadmium is relatively high for a vegetable, averaging 0.06 mg/kg (max 0.59). Lead and arsenic are low
- Taro (satoimo) and potatoes (jagaimo)Some unpeeled taro samples have lead at or above the limit of quantification, but every peeled sample was below it. Cd averages 0.02–0.04
- Green tea (tea leaves)In tea leaves, lead was below the limit of quantification in 77 of 120 samples. Lead that comes out into brewed tea is about 8.8% of that in the leaves
Foods for infants2 items
Baby food and infant formula. Intake per kg of body weight tends to be higher than for adults
- Baby food (foods for infants and toddlers)Lead was below the limit of quantification in 151 of 180 samples. Arsenic and cadmium are higher in dry-type products
- Infant formula (powdered milk)Lead in the powder is at most 0.015 mg/kg and inorganic arsenic at most 0.047. Lead after mixing is estimated to average 0.0004–0.0010 mg/L
Other5 items
Chocolate, spices, canned fruit, tap water and meat
- Chocolate and cocoaCadmium averages 0.20 mg/kg (max 2.3). Even at the same cocoa content, products differ by orders of magnitude
- Spices such as turmeric and cinnamonNo Japanese public survey values or standards were found. The EU has limits by type, and Codex is adopting them in stages
- Canned fruitLead in canned fruit fell from an average of 0.06 mg/kg in 2013 to 0.02 in 2016. 98% of tin intake comes from canned fruit and bamboo shoots
- Tap water and mineral waterThe standard for both lead and arsenic in tap water is 0.01 mg/L. 1.92 million lead service pipes remain nationwide (fiscal 2023)
- Meat (beef, pork, chicken)Cadmium in muscle is low, at a maximum of 0.03–0.07 mg/kg. No Japanese public data were found for liver or kidney
Limits for major foods and metals (Japan, Codex, EU)
mg/kg. “None” means we did not find one in our search. Codex values are from MAFF’s excerpt; EU values from the original Regulation 2023/915 (since amended). See How limits differ in Japan and abroad.
| Food | Metal | Japan | Codex | EU (Reg. 2023/915) |
|---|---|---|---|---|
| Polished rice | Cadmium | 0.4 (brown and polished rice) | 0.4 | 0.15 |
| Polished rice | Inorganic arsenic | None | 0.2 | 0.15 (excluding parboiled rice) |
| Brown rice | Inorganic arsenic | None | 0.35 | 0.25 (also parboiled rice) |
| Rice crackers | Inorganic arsenic | None | — | 0.30 |
| Rice for infants and young children | Inorganic arsenic | None | — | 0.10 |
| Fish and shellfish | Mercury | Total mercury 0.4, methylmercury 0.3 (provisional regulatory limits; not applied to tuna-type fish, river fish, deep-sea fish and others) | Methylmercury 0.5 (1 for predatory fish) | 0.50 (1.0 for tuna, shark, swordfish etc.; 0.30 for squid, mackerel, salmon etc.) |
| Fish (muscle) | Lead | None | 0.3 | 0.30 |
| Fish (muscle) | Cadmium | None | — | 0.050 (0.10 mackerel and tuna; 0.25 swordfish and sardines) |
| Leafy vegetables | Lead | None | 0.3 (excluding spinach) | 0.30 |
| Spinach | Cadmium | None | 0.2 (leafy vegetables) | 0.20 |
| Wheat | Cadmium | None | 0.2 | 0.10 (cereals in general) |
| Cocoa powder | Cadmium | None | 2.0 | 0.60 (sold to consumers) |
| Chocolate (50% or more cocoa solids) | Cadmium | None | 0.8 (50–70%), 0.9 (70% or more) | 0.80 |
| Infant formula | Lead | None | 0.01 | 0.020 (powder) / 0.010 (liquid) |
| Dried spices (bark) | Lead | None | Adopted step by step since 2024 (values being checked in CXS 193) | 2.0 (roots and rhizomes 1.50) |
| Fruit juice | Lead | Must not be detected (soft drinks) | 0.03 | 0.030 |
| Tap water | Lead | 0.01 mg/L (Water Supply Act standard) | — | — |
| Mineral water | Lead | 0.05 mg/L (Food Sanitation Act) | 0.01 mg/L (natural mineral water) | — |
The Codex value for mercury is the 1991 guideline (methylmercury 0.5, predatory fish 1). Codex also adopted maximum levels for six predatory fish in 2022 (tuna 1.2 and others), but we could not check the original text. For lead in spices, Japan has no limit and the EU has one; Codex has been adopting limits for dried spices since 2024 (bark and culinary herbs were endorsed by the committee in 2025, with final adoption by the Commission still to come).
2024 intake of the four metals compared with tolerable intakes
Estimated intake from the average Japanese diet (total diet study, body weight 55 kg) set against each body’s tolerable intake. The ratio is intake ÷ tolerable intake; above 1 means intake exceeds that yardstick. See 50 years of heavy-metal intake in Japan.
| Metal | Estimated intake | Yardsticks compared | Ratio / margin |
|---|---|---|---|
| Inorganic arsenic | 0.39 μg/kg/day (21.2 μg/person/day) | US EPA RfD 0.3 μg/kg/day, EFSA 2005 provisional TWI 1.5 μg/kg/week, JECFA BMDL0.5 3.0 μg/kg/day | Ratio 1.28–1.80 (EPA and EFSA 2005 yardsticks). Margin of exposure (MOE) against the JECFA BMDL0.5 is 7.8. The Food Safety Commission of Japan has not set a tolerable intake |
| Cadmium | 0.24 μg/kg/day (13.4 μg/person/day) | Food Safety Commission TWI 7, EFSA TWI 2.5, JECFA PTMI 25 μg/kg/month | Ratio 0.24–0.68 |
| Methylmercury | 0.067 μg/kg/day (fish, meat/eggs and rice groups only; total mercury 5.04 μg/person/day) | Food Safety Commission TWI 2.0, JECFA 1.6, EFSA 1.3 μg/kg/week | Ratio 0.24–0.36 |
| Lead | 0.072 μg/kg/day (3.96 μg/person/day; ages 1–6: 0.182 μg/kg/day) | No tolerable intake. EFSA 2010 BMDL01 0.50 (developmental neurotoxicity), 1.50 (blood pressure), BMDL10 0.63 (kidney) | Margin from the reference points (MOE): about 7–21 for the all-age average, about 2.7–8 for ages 1–6 (our calculation; 0.50 is the reference point for children’s developmental neurotoxicity, 1.50 and 0.63 for adults’ blood pressure and kidneys) |
Source: Table 9 of the FY2024 MHLW-funded report (the lead margins are our division of the same table’s intake by the EFSA 2010 reference points). Ratios change with the yardstick chosen. The Food Safety Commission of Japan, which has not set a tolerable intake for inorganic arsenic, says there are no data showing health effects from a normal diet and that it does not consider the current situation a problem.
Main sources
- MHLW-funded total diet study, fiscal 2024 (National Institute of Health Sciences)
- MHLW, advice for pregnant women on eating fish and shellfish and mercury
- MAFF, surveys of arsenic in food (updated December 19, 2025)
- MAFF, survey of cadmium and arsenic in rice from the 2022–24 crops (December 19, 2025)
- Food Safety Commission of Japan, information on the lead risk assessment (June 29, 2021)
- MAFF, lead limits set by international bodies and other countries (Codex table)
- EU Regulation 2023/915 (maximum levels for contaminants in food)
- EFSA CONTAM Panel. EFSA J 2024;22(1):e8488 (inorganic arsenic)
Last checked 2026.10.03 (against the original government documents and papers, collected and cross-checked in Gemini Notebook).