

What Is Sake Meter Value (SMV)? Acidity, Sweetness Index and Richness Index by the Government Formula | Interactive Sake Meter and Prefecture Sweet/Dry Map

PR This article contains affiliate links to Rakuten Ichiba, Moshimo Affiliate and A8.net. What it says is based on materials from the National Tax Agency, the National Research Institute of Brewing and public research institutes, regardless of any advertising. Sake is for adults aged 20 and older. The “See on Amazon.co.jp” and “See on Yahoo! Shopping” links are also affiliate links.
On sake labels and online shop pages you sometimes see numbers such as “SMV +4,” “acidity 1.3” and “amino acidity 1.2.” People often say “a positive SMV means dry,” but that alone does not decide whether a sake is sweet or dry.
This article sorts out what the label numbers mean, based on the National Tax Agency (NTA) analysis rules and nationwide survey results. You can do more than read: you can check things with calculators that run on the government formulas exactly as published.
- What the sake meter value (SMV, nihonshu-do) actually measures, and why “weight” works as a guide to sweetness
- What acidity and amino acidity are amounts of
- How the sweetness index and richness index are calculated: the 1974 formulas and the 2004 “new sweetness value”
- Sweetness and richness by prefecture (the NTA’s 4-year average)
For how sake is made and rice polishing ratios, see the article on how sake is made. For ingredients and health, see the article on sake and health. For history and famous production areas, see the article on sake history and culture.
Conclusions
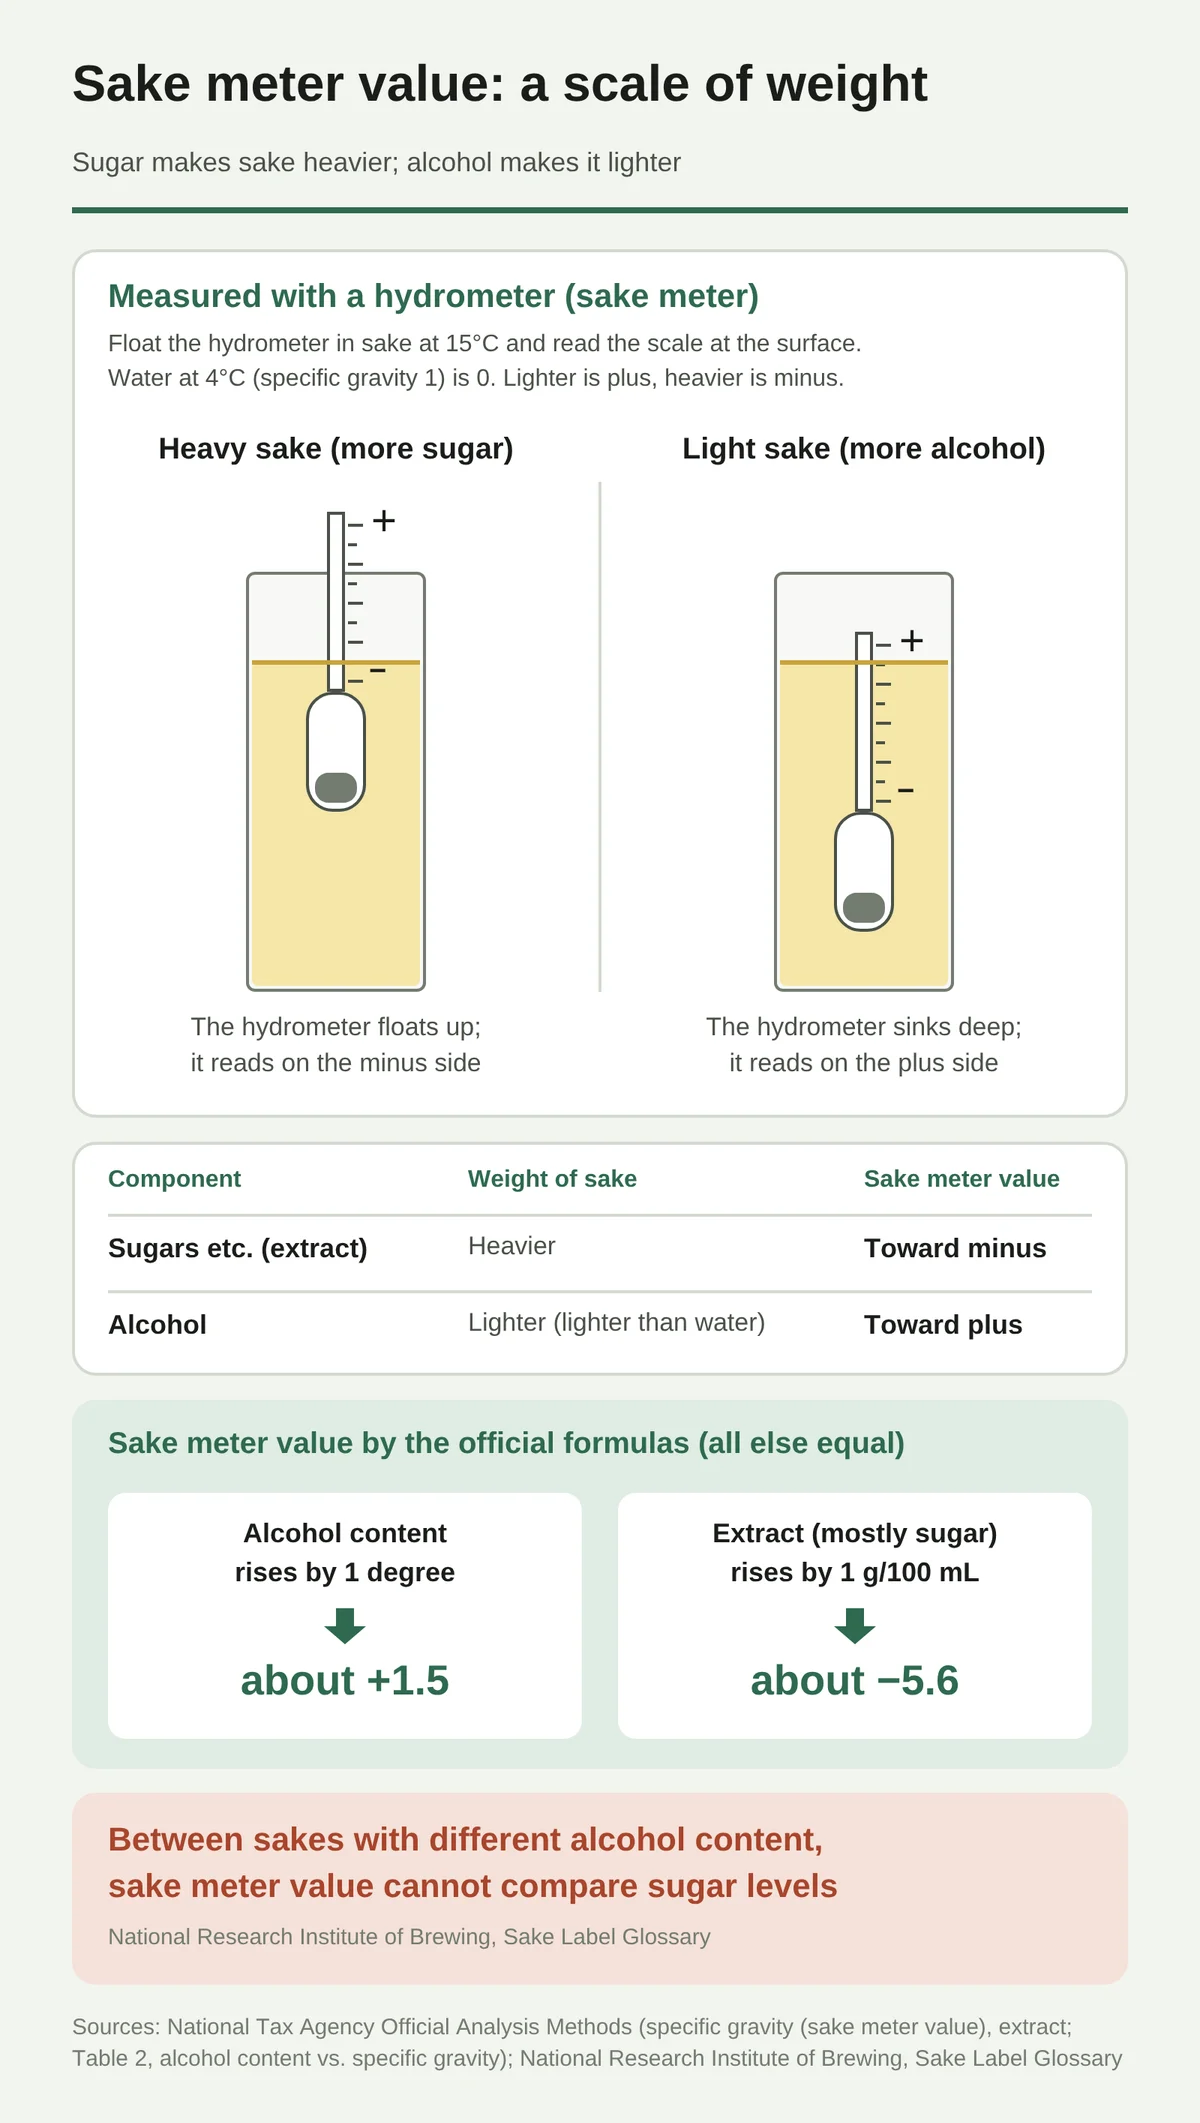
- SMV is not “sweetness” but “weight” (specific gravity). Measured at 15°C, the weight of water at 4°C is 0. The lighter the sake, the higher the positive number; the heavier, the lower the negative number
- Weight is determined mainly by sugar (makes it heavier) and alcohol (makes it lighter). By the government formula, with everything else equal, each 1-point rise in alcohol content moves SMV by about +1.5, and each 1 g/100 mL increase in extract (mostly sugar) moves it by about −5.6. For sakes with different alcohol content, SMV cannot be used to compare the amount of sugar
- Acid masks sweetness. At the same SMV, a sake with higher acidity tends to taste drier. That is why the NTA uses the sweetness index and richness index, calculated from SMV and acidity
- That sweetness index (the 1974 formula) puts almost all of today’s commercial sake on the dry side, which does not match how it tastes. In 2004, researchers at the National Research Institute of Brewing proposed a “new sweetness value” (AV) based on the difference between glucose and acidity
- SMV and acidity are numbers that the national labeling standards neither require nor give rules for. Breweries print them voluntarily, and they change from batch to batch even within the same brand
Items featured in this article
Following the points in the text, the article features the items below.
| For people who… | Item featured | Where |
|---|---|---|
| Want to measure the SMV of sake at home | Sake meter (Toa Keiki F-1310) | Trying a sake meter |
| Want to taste for themselves that “SMV alone does not decide it” | Hakkaisan Seishu / Hakkaisan Junmai Ginjo 55% | Checking with sake from one brewery |
| Want to try sake at the sweet extreme | Hakkaisan Kijoshu / Hakkaisan Sparkling Nigori | Sake at the sweet extreme |
| Want to compare small amounts from many breweries | SAKEPOST and saketaku (sake subscription boxes) / sake specialty shop GINTEN | Taste, compare, and plot |
The numbers printed on labels
| Number | What it represents | How it is measured (NTA Official Analysis Methods) | National average (regular sake) |
|---|---|---|---|
| SMV (nihonshu-do) | Weight (specific gravity) of the sake. The higher the plus, the lighter | A hydrometer (sake meter) is floated in sake at 15°C and read | +3.5 |
| Acidity (san-do) | Amount of acids such as lactic, succinic and malic acid | mL of alkaline solution (0.1 mol/L) needed to neutralize 10 mL of sake | 1.18 |
| Amino acidity (amino-san-do) | Amount of amino acids such as glutamic acid | After neutralizing 10 mL of sake, mL needed to neutralize again after adding formalin | 1.14 |
| Alcohol content | mL of alcohol per 100 mL of sake | Distilled, then read with an alcohol hydrometer | 15.30% |
| Sweetness index (amakara-do) / richness index (notan-do) | Guides to sweet ↔ dry and rich ↔ light | Calculated from SMV and acidity | −0.10 / −0.95 |
National averages are the averages of the 194 regular sake samples in the NTA “Results of the Nationwide Survey of Commercial Alcoholic Beverages (fiscal 2023),” Table 8. Regular sake (ippanshu) means sake other than ginjo, junmai and honjozo (the special-designation sake). The national values in “Sweetness map by prefecture” below (sweetness −0.10, richness −0.98) are 4-year averages for fiscal 2020–2023, a different period from this table.
No rule requires them
The NTA’s Labeling Standards for Production Method and Quality of Sake list items that must be on the label (ingredients, the rice polishing ratio for special-designation sake, storage cautions for namazake, and so on) and items that have conditions for when they are written (rice variety, genshu, namazake, nama-chozoshu, kiippon, taruzake, and so on).
SMV, acidity and amino acidity are in neither group. Whether to print them is up to each brewery, and many brands do not.
- Hakkaisan’s official product pages say that the printed values and rice may vary or change somewhat
- In practice, acidity for the same product sometimes differed by 0.1 to 0.2 between the official site and an online shop’s page (checked on October 14, 2026)
It seems best to read the numbers as “roughly where that sake sits.”
Sake meter value: a measure of weight, not sweetness
How SMV is measured
The NRIB “Sake Label Glossary” of the National Research Institute of Brewing explains SMV as follows.
- SMV is a scale unique to sake that expresses the specific gravity of sake
- It is measured at 15°C, with the weight of water at 4°C (specific gravity 1) set to 0. Lighter sake is positive; heavier sake is negative
- A hydrometer (sake meter) is floated in sake brought to 15°C, and the scale is read
Under the NTA Official Analysis Methods, it can also be calculated from the specific gravity (15/4°C) measured with a density meter, using this formula.
SMV = 1443 ÷ specific gravity − 1443
A specific gravity of 1.000 gives 0, 0.997 gives about +4.3, and 1.003 gives about −4.3. You could say it turns differences in the third decimal place into numbers that are easier to handle.
Sugar and alcohol determine the weight
The weight of sake changes with what is dissolved in it.
| Component | Effect on weight | Effect on SMV |
|---|---|---|
| Sugars and others (extract) | Makes it heavier | Toward negative |
| Alcohol | Makes it lighter (lighter than water) | Toward positive |
The NRIB glossary says that SMV has been used as a guide to sweetness because it changes with sugar, but that the amount of sugar cannot be compared by SMV unless the sakes have similar alcohol content. The NTA likewise explains that it is “high in sake with high alcohol and little extract, and low in sake with low alcohol and much extract.”
The NTA Official Analysis Methods have a formula that gets the extract (the grams of non-evaporating components dissolved in 100 mL of sake, mostly sugar) from SMV and alcohol content.
Extract = (specific gravity − specific gravity of water with the same alcohol content) × 260 + 0.21
Used in reverse, this formula gives SMV from alcohol content and extract. Entering the national averages (regular sake: alcohol 15.30%, extract 4.54) gives +3.7, almost the same as the +3.5 average SMV the NTA published (for ginjo, junmai and honjozo the difference is also within 0.2).
Try it: sake meter simulator
Move the alcohol content and extract, and the specific gravity and SMV are calculated with the NTA Official Analysis Methods formula and conversion table (the table of alcohol content versus specific gravity), while the hydrometer floats up and down.
Trying it shows the following.
- Starting from the regular sake average and raising only the alcohol by 1 point moves SMV by about +1.5. Not a bit of sugar has gone away, yet the number moves to the dry side
- Raising only the extract (sugar) by 1 g/100 mL moves SMV by about −5.6
- At the same SMV of +5, a genshu (undiluted sake) at 18% alcohol has about 5.0 g of extract and a sake at 14% has about 4.0 g. That means the higher-alcohol sake has more sugar
- Adding water dilutes both alcohol and sugar, so SMV changes less
Trying a sake meter
A sake meter is a relative of the hydrometer used in school science experiments. A glass hydrometer is floated in sake at 15°C, and the scale is read at the liquid surface. At home you can measure with a graduated cylinder (measuring cylinder) and a thermometer.
Acidity and amino acidity
Acidity: the amount of acid
According to the NTA, acidity is an index of the amount of organic acids such as lactic, succinic and malic acid.
- How it is measured: an indicator is added to 10 mL of sake, which is neutralized with 0.1 mol/L sodium hydroxide solution. The mL of solution used is the acidity (NTA Official Analysis Methods)
- An acidity of 1.0 corresponds to about 0.059 g per 100 mL when converted to succinic acid
- National averages are 1.18 for regular sake, 1.25 for ginjo, 1.46 for junmai and 1.22 for honjozo (fiscal 2023)
The NTA writes that it “affects the sweetness/dryness and richness of taste, and sake with higher acidity is generally perceived as drier and richer.” The NRIB glossary also explains that “sourness has the property of masking sweetness, so a sake with strong sourness is perceived as drier even at the same sugar content.”
Amino acidity: the amount of umami source
Amino acidity is an index of the amount of amino acids such as glutamic acid.
- How it is measured: after neutralizing as for acidity, formalin is added, and the acid that appears is neutralized once more. That mL is the amino acidity
- An amino acidity of 1.0 corresponds to about 0.075 g per 100 mL when converted to glycine
- National averages are 1.14 for regular sake, 1.08 for ginjo, 1.38 for junmai and 1.14 for honjozo
- The NTA writes that “sake with higher amino acidity is generally perceived as richer”
The ranking is that junmai is highest in both acidity and amino acidity, while ginjo is lowest in amino acidity.
Numbers for aroma
The stars of ginjo’s fruity aroma are isoamyl acetate (banana-like) and ethyl caproate (apple-like). In the NTA survey, the average of 47 ginjo samples was 1.76 mg/L of isoamyl acetate and 3.80 mg/L of ethyl caproate. Both are aromas made by yeast; which yeast is used is covered in the article on how sake is made.
Sweetness index and richness index
The formulas used by the NTA
In its nationwide surveys of commercial sake, the NTA calculates the following two values from SMV and acidity.
Sweetness index = 193593 ÷ (1443 + SMV) − 1.16 × acidity − 132.57 Richness index = 94545 ÷ (1443 + SMV) + 1.88 × acidity − 68.54
- The sweetness index means the higher, the sweeter; the lower, the drier. The NTA color-codes it into four bands, with boundaries at 0.2, 0.0 and −0.2
- The richness index means the higher, the richer; the lower, the lighter. It has four bands, with boundaries at −0.6, −0.8 and −1.0
- From the formulas, as acidity rises the sweetness index falls (drier) and the richness index rises (richer)
Here is the SMV at which the sweetness index is 0, calculated for each acidity.
| Acidity | SMV at which the sweetness index is 0 |
|---|---|
| 1.0 | +4.6 |
| 1.2 | +2.1 |
| 1.4 | −0.4 |
| 1.6 | −2.9 |
| 1.8 | −5.3 |
| 2.0 | −7.8 |
For every 0.1 rise in acidity, the boundary drops by about 1.2 in SMV. A sake with acidity 1.8 has a negative sweetness index (dry side) even at an SMV of −5.
The original 1974 formulas
This sweetness index and richness index come from the 1974 paper by Sato et al., “Studies on the taste of sake (Part 3): multiple regression equations for sweetness/dryness and richness” (as cited in the 2013 Bulletin of the Tokyo Metropolitan Agriculture and Forestry Research Center).
A paper by Utsunomiya et al. of the National Research Institute of Brewing (Journal of the Brewing Society of Japan, 2004) points out the following about these formulas.
- The original formula expresses sweetness/dryness by reducing sugar and acidity. The formula that calculates from SMV and acidity was made by assuming reducing sugar to be 60% of extract
- When checked against the 2001 survey of commercial sake, the fit for estimating reducing sugar from extract was low
- The original formula was built with a sake of 17% alcohol, acidity 1.8 and reducing sugar 4 g/100 mL as a sweetness index of 0, so almost all of today’s commercial sake comes out dry (negative), which does not match how it tastes
- Alcohol content is not in the formula. As the earlier section showed, the amount of sugar differs at the same SMV when alcohol content differs
The 2004 “new sweetness value”
Utsunomiya et al. proposed the “new sweetness value” (AV), which determines sweetness/dryness from glucose and acidity.
New sweetness value = glucose (g/100 mL) − acidity
| New sweetness value | Category |
|---|---|
| 0.2 or less | Dry |
| 0.3 to 1.0 | Somewhat dry |
| 1.1 to 1.8 | Somewhat sweet |
| 1.9 or more | Sweet |
- The coefficients for glucose and acidity were almost the same, so a simple difference form was used
- It matched sensory evaluation well both for people with much drinking experience (participants in sake brewing courses) and those with little (university students and others)
- Applied to the 2001 nationwide survey of commercial alcoholic beverages (1,330 samples), over 70% of regular sake came out “somewhat sweet” or “sweet,” while about 80% of junmai came out “dry” or “somewhat dry”
Glucose is rarely printed on labels, but calculated from the NTA’s fiscal 2023 averages, the new sweetness value is 0.95 for regular sake, 0.71 for ginjo and 0.37 for honjozo (all “somewhat dry”), and −0.03 for junmai (“dry”). The 2001 shares above were counted bottle by bottle, in a different year and on different sake, so they cannot be compared directly with these figures calculated from averages. Regular sake’s 0.95 is close to the border with “somewhat sweet” (1.1).
Calculator: plot the label numbers
Enter SMV and acidity, and the calculator works out the sweetness index and richness index and places them on the same chart as the NTA’s averages by prefecture and by type. If you know the glucose, it also gives the new sweetness value. You can also paste text from a label or shop page and have the numbers read from it.
- With “Keep this sake on the chart to compare,” you can line up as many as you like, and “Copy URL” lets you send the comparison to someone
- The numbers you enter are not sent to a server; they are calculated only within this screen
Checking with sake from one brewery
Hakkaisan (Hakkai Brewery) in Niigata Prefecture lists SMV, acidity and amino acidity on its official product pages. Even sake from the same brewery is quite scattered on the chart.
| Sake (values from Hakkaisan’s official site) | Alcohol | SMV | Acidity | Sweetness index | Richness index | Chart |
|---|---|---|---|---|---|---|
| Hakkaisan Seishu (futsushu, regular sake) | 15.5% | +5.0 | 1.1 | −0.15 | −1.18 | |
| Hakkaisan Tokubetsu Honjozo | 15.5% | +4.0 | 1.3 | −0.29 | −0.76 | |
| Hakkaisan Junmai Ginjo 55% | 15.5% | +1 | 1.7 | −0.47 | +0.13 | |
| Hakkaisan Tokubetsu Junmai Genshu | 17.0% | ±0 | 1.8 | −0.50 | +0.36 | |
| Hakkaisan Sparkling Nigori | 15.0% | −23.0 | 1.8 | +1.68 | +1.42 | |
| Hakkaisan Kijoshu | 17.0% | −36.0 | 2.5 | +2.12 | +3.36 |
Values checked on Hakkaisan’s official site on October 14, 2026. The sweetness index and richness index were calculated by Urayomi with the NTA formulas.
The clearest case is Hakkaisan Seishu versus Junmai Ginjo 55%.
- Looking only at SMV, Junmai Ginjo 55% (+1) looks sweeter than Hakkaisan Seishu (+5.0)
- But acidity is 1.1 versus 1.7. As sweetness indexes they are −0.15 and −0.47, so Junmai Ginjo 55% sits on the drier side
- On the richness index, −1.18 versus +0.13, Junmai Ginjo 55% is much further toward rich
These are two easy-to-find bottles from the same brewery, so you can taste them side by side to check.
Sake at the sweet extreme
The bottom two in the table fly out beyond the upper right (sweet and rich) of the chart.
- Kijoshu is brewed by replacing part of the brewing water with sake. The Brewing Experiment Station, the predecessor of the National Research Institute of Brewing, devised it with a hint from an old brewing method in the Engishiki (a 10th-century code) of the Heian period (NRIB Sake Label Glossary). Hakkaisan’s kijoshu has an SMV of −36, acidity 2.5 and a sweetness index of +2.12
- Sparkling nigori has an SMV of −23. Its acidity is also high at 1.8, but more than enough sugar offsets it and it lands on the sweet side
Hakkaisan’s “Shirakoji Awa” (a sparkling sake with secondary fermentation in the bottle) has an acidity of 6.5, which gives a sweetness index of −6.0 in the formula, far off the chart. It is a sake that makes use of the citric acid from white koji, and it seems best to think of it as outside the range the sweetness-index formula was originally meant for.
Sweet/dry map by prefecture
The NTA publishes the sweetness index and richness index of regular sake by prefecture (4-year average for fiscal 2020–2023). The grid below is laid out in the shape of a map of Japan; tap a square to see its value and rank.
- Sweet side: Okayama +0.38, Oita +0.27, Hyogo and Nagasaki +0.22
- Dry side: Gifu −0.50, Kochi −0.48, Tottori −0.47, Toyama and Aichi −0.46
- Rich side: Gifu −0.29, Mie −0.51, Aichi −0.59
- Light side: Niigata −1.40, Tochigi −1.33, Hiroshima and Ehime −1.28
- Nationwide: sweetness index −0.10, richness index −0.98
True to the image of “Niigata sake is light,” Niigata had the lowest richness index (lightest side) of any prefecture.
Some cautions when reading it.
- It covers regular sake only (sake that is not special-designation). Ginjo and junmai are not included
- Each year the NTA selects about a quarter of the producers in each regional taxation bureau’s area and analyzes products bought in shops. The plan is to go around almost all producers in four years
- Values for Miyazaki, Kagoshima and Okinawa are not published
| Prefecture | Sweetness index | Richness index | Prefecture | Sweetness index | Richness index |
|---|---|---|---|---|---|
| Hokkaido | −0.01 | −1.11 | Shiga | −0.02 | −0.82 |
| Aomori | −0.14 | −0.99 | Kyoto | −0.06 | −0.66 |
| Iwate | −0.01 | −1.16 | Osaka | +0.09 | −0.79 |
| Miyagi | −0.15 | −0.75 | Hyogo | +0.22 | −1.00 |
| Akita | −0.10 | −0.80 | Nara | 0.00 | −0.92 |
| Yamagata | −0.10 | −1.17 | Wakayama | −0.19 | −0.70 |
| Fukushima | +0.05 | −1.04 | Tottori | −0.47 | −0.94 |
| Ibaraki | −0.12 | −1.22 | Shimane | −0.19 | −1.11 |
| Tochigi | +0.09 | −1.33 | Okayama | +0.38 | −1.03 |
| Gunma | 0.00 | −1.24 | Hiroshima | +0.18 | −1.28 |
| Saitama | +0.02 | −1.01 | Yamaguchi | −0.16 | −0.72 |
| Chiba | −0.17 | −1.18 | Tokushima | −0.44 | −0.83 |
| Tokyo | −0.23 | −1.10 | Kagawa | −0.45 | −0.84 |
| Kanagawa | −0.27 | −1.09 | Ehime | +0.08 | −1.28 |
| Niigata | −0.14 | −1.40 | Kochi | −0.48 | −0.97 |
| Toyama | −0.46 | −1.18 | Fukuoka | −0.20 | −0.94 |
| Ishikawa | −0.33 | −0.71 | Saga | +0.19 | −0.97 |
| Fukui | −0.14 | −1.02 | Nagasaki | +0.22 | −1.00 |
| Yamanashi | −0.20 | −1.16 | Kumamoto | −0.22 | −0.81 |
| Nagano | −0.04 | −1.17 | Oita | +0.27 | −0.96 |
| Gifu | −0.50 | −0.29 | Miyazaki | — | — |
| Shizuoka | −0.37 | −0.97 | Kagoshima | — | — |
| Aichi | −0.46 | −0.59 | Okinawa | — | — |
| Mie | −0.23 | −0.51 |
Taste, compare, and plot
The more sake you have actually tasted, the more interesting the points on the calculator become. Sake subscription boxes and specialty online shops are ways to try small amounts from many breweries.
Averages by type
| Type (NTA category) | Samples | Alcohol | SMV | Acidity | Amino acidity | Glucose g/100 mL | Sweetness index | Richness index |
|---|---|---|---|---|---|---|---|---|
| Regular sake | 194 | 15.30 | +3.5 | 1.18 | 1.14 | 2.13 | −0.10 | −0.95 |
| Ginjo | 47 | 15.45 | +1.4 | 1.25 | 1.08 | 1.96 | +0.01 | −0.73 |
| Junmai | 46 | 14.97 | +2.8 | 1.46 | 1.38 | 1.43 | −0.36 | −0.40 |
| Honjozo | 44 | 15.53 | +4.6 | 1.22 | 1.14 | 1.59 | −0.25 | −0.93 |
NTA “Results of the Nationwide Survey of Commercial Alcoholic Beverages (fiscal 2023),” Table 8. In this survey, junmai ginjo, junmai daiginjo and daiginjo are included in ginjo; tokubetsu junmai in junmai; and tokubetsu honjozo in honjozo. The sweetness index and richness index are the values in the NTA table.
- The highest SMV (lightest) is honjozo at +4.6, and the lowest is ginjo at +1.4
- Even so, in the sweetness index ginjo is the sweetest side at +0.01 and junmai the driest side at −0.36. This is because junmai has higher acidity
Quiz: which tastes sweeter?
You can test what you have read so far with a 5-question quiz.
Cautions when reading label numbers
- Do not decide sweet or dry by SMV alone: look at acidity and alcohol content too. If acidity is printed, you can turn it into a sweetness index and richness index with the calculator in this article
- Genshu and low-alcohol sake are hard to compare: with different alcohol content, the amount of sugar differs even at the same SMV
- Read the “dry” of the sweetness index with a discount: the 1974 formula puts many of today’s commercial sakes on the dry side. On the new sweetness value, by contrast, most regular sake was “somewhat sweet” or above (2001 survey)
- They change even within the same brand: these numbers have no labeling requirement or rule for how to write them, and they change from batch to batch
- How sake tastes also changes with temperature, food and aroma. The numbers are a guide to “roughly where on the chart it sits”
Items featured in this article (summary)
Here are the items featured in the article, gathered once more. The reasons and ingredients are written in each section.
| Item featured | Where to buy |
|---|---|
| 東亜計器製作所 日本酒度計 ツバ無し F-1310 (Toa Keiki sake meter, no collar) | See on Rakuten (DIY FACTORY ONLINE SHOP) PR See on Amazon.co.jp PR See on Yahoo! Shopping PR |
| Hakkaisan Seishu 720 ml (regular sake; 清酒 八海山) | See on Rakuten (FELICITY 地酒) PR See on Amazon.co.jp PR See on Yahoo! Shopping PR |
| Hakkaisan Junmai Ginjo 55% 720 ml (純米吟醸 八海山 55%) | See on Rakuten (FELICITY 地酒) PR See on Amazon.co.jp PR See on Yahoo! Shopping PR |
| Hakkaisan Kijoshu 300 ml (八海山 貴醸酒) | See on Rakuten (FELICITY 地酒) PR See on Amazon.co.jp PR See on Yahoo! Shopping PR |
| Hakkaisan Sparkling Nigori 720 ml (発泡にごり酒 八海山) | See on Rakuten (FELICITY 地酒) PR See on Amazon.co.jp PR See on Yahoo! Shopping PR |
| SAKEPOST (sake subscription box) | SAKEPOST の定期便を見る |
| saketaku (sake subscription box) |  |
| Sake specialty shop 吟天 (GINTEN) | 世界が認めたラグジュアリー日本酒【吟天】  PR |
Summary
- SMV is “weight.” Sugar lowers it and alcohol raises it
- Acid masks sweetness and makes the taste seem richer. That is why the sweetness index and richness index, which combine SMV and acidity, exist
- The sweetness index the NTA uses (the 1974 formula) tends to come out on the dry side. In 2004, a new sweetness value using glucose was also proposed
- By prefecture, Okayama is on the sweetest side and Niigata on the lightest side (regular sake, 4-year average)
- SMV and acidity are numbers with no obligation to appear on labels. Plot them on the calculator and use it to find where your own taste sits
Notice Sake is for adults aged 20 and older. Drinking under 20 is prohibited by law. Do not drink during pregnancy or breastfeeding, and never drink and drive. The items introduced here are not intended to show anything good for health. Prices and shipping fees may change (shipping varies by region).
Sources
- National Tax Agency, “Results of the Nationwide Survey of Commercial Alcoholic Beverages (fiscal 2023)” (2025) (in Japanese) https://www.nta.go.jp/taxes/sake/shiori-gaikyo/seibun/2024/pdf/001.pdf
- National Tax Agency, “NTA Official Analysis Methods” (sake: specific gravity (SMV), total acid, amino acids, extract; Table 2, conversion table of alcohol content and specific gravity) (in Japanese) https://www.nta.go.jp/law/tsutatsu/kobetsu/sonota/070622/pdf/kokuzeityo-syoteibunsekihou.pdf
- National Tax Agency, “Notification Establishing the Labeling Standards for Production Method and Quality of Sake” (NTA Notification No. 8 of 1989, amended 2022) (in Japanese) https://www.nta.go.jp/taxes/sake/hyoji/seishu/kokuji891122/03.htm
- National Research Institute of Brewing, “Sake Label Glossary” (in Japanese) https://www.nrib.go.jp/sake/pdf/nlziten_j.pdf
- Utsunomiya H, Isogai A, Iwata H. “On the labeling of sweetness/dryness categories of sake.” Journal of the Brewing Society of Japan 99(12), 882-889 (2004) (in Japanese) https://doi.org/10.6013/jbrewsocjapan1988.99.882
- Saegusa S et al. “Analysis of taste characteristics of sake produced in Tokyo in the 2008–2010 brewing years.” Bulletin of the Tokyo Metropolitan Agriculture and Forestry Research Center 8: 35-48 (2013) (in Japanese) https://www.tokyo-aff.or.jp/uploaded/attachment/7260.pdf
- Sato et al. “Studies on the taste of sake (Part 3): multiple regression equations for sweetness/dryness and richness” (1974) (in Japanese). Note: cited from the two sources above
- Hakkai Brewery, “Hakkaisan sake” product pages (checked October 14, 2026) https://www.hakkaisan.co.jp/sake/
Shop in the US PR
Links to shops that deliver in the US. These are not recommendations of a specific product; check the label and certifications before you buy. Urayomi may earn a commission from purchases made through these links. As an Amazon Associate, Urayomi earns from qualifying purchases.
Frequently asked questions
- What are the key findings on: What Is Sake Meter Value (SMV)? Acidity, Sweetness Index and Richness Index by the Government Formula?
- Sake meter value measures specific gravity, not sweetness: 1 point more alcohol moves SMV about +1.5, and acidity makes sake taste drier. Simulator, map.
- What does the evidence show regarding: Items featured in this article?
- Following the points in the text, the article features the items below.
- What does the evidence show regarding: The numbers printed on labels?
- National averages are the averages of the 194 regular sake samples in the NTA “Results of the Nationwide Survey of Commercial Alcoholic Beverages (fiscal 2023),” Table 8. Regular sake (ippanshu) means sake other than ginjo, junmai and honjozo (the special-de…
- What does the evidence show regarding: Sake meter value: a measure of weight, not sweetness?
- The NRIB “Sake Label Glossary” of the National Research Institute of Brewing explains SMV as follows.
Related articles and databases
- What Is the Rice Polishing Ratio? How Sake Is Made, Flat Polishing, and Yeast: Reading the Words on the Label from Government Sources
- Is Sake Good for Your Health? Checking Ingredients, Calories, Weight Gain, and the Comparison with Shochu Against Public Data and Studies
- Why Is Sake Sacred? Its History, Shinto, Famous Regions, Premium Bottles, and Popularity Overseas, Read Through Government Sources