
PFAS in tap water database (Japan)
We list, prefecture by prefecture, the PFOS and PFOA levels (combined, highest value each fiscal year) that water utilities across Japan reported to the national government. The data come from the national surveys by MLIT and the Ministry of the Environment (published November 2024 and December 2025) and cover FY2020 to FY2025 (to the end of August 2025). 50 ng/L was a provisional target until March 2026 and became a legal water quality standard on 1 April 2026. Alongside the numbers you can see where the water was sampled (tap or untreated raw water), which bulk supplier a utility buys from, and what local governments publish themselves. We do not call water “dangerous” or “safe”; we only show official values and how to read them.

Search by city or utility (in Japanese)
Search the roughly 3,400 utilities in the national table by city or utility name (in Japanese). Tap a result to jump to that row on the prefecture page.
What we know
- From FY2020 to the end of August 2025, 19 water utilities exceeded 50 ng/L. As of December 2025, 18 had taken measures and 1 was under emergency response (the government did not name it).
- The number above 50 fell from 11 in FY2020 to 3 in FY2023 and 0 in FY2024 (to September). Later tests, however, found 2 utilities above 50 in FY2024 and 4 in FY2025 (to August). Utilities that tested rose from 466 in FY2020 to 3,201 in total by August 2025. Most of them found nd (below the limit of measurement).
- The highest value was 1,400 ng/L in Kibichuo Town, Okayama (FY2022). After a change of water source and replacement of activated carbon, it was nd in FY2024 and FY2025 (Okayama page).
- As of October 2026, the government has not yet published utility-by-utility values since the standard took effect in April 2026. The latest values are in what Sakai City, the Osaka Water Supply Authority, the Tokyo Waterworks Bureau, the Okinawa Prefectural Enterprise Bureau and others publish themselves.
Reading the numbers
- A value in the national table is “the highest value for that utility in that year”. For utilities with several treatment plants, it is not necessarily the value at your own tap.
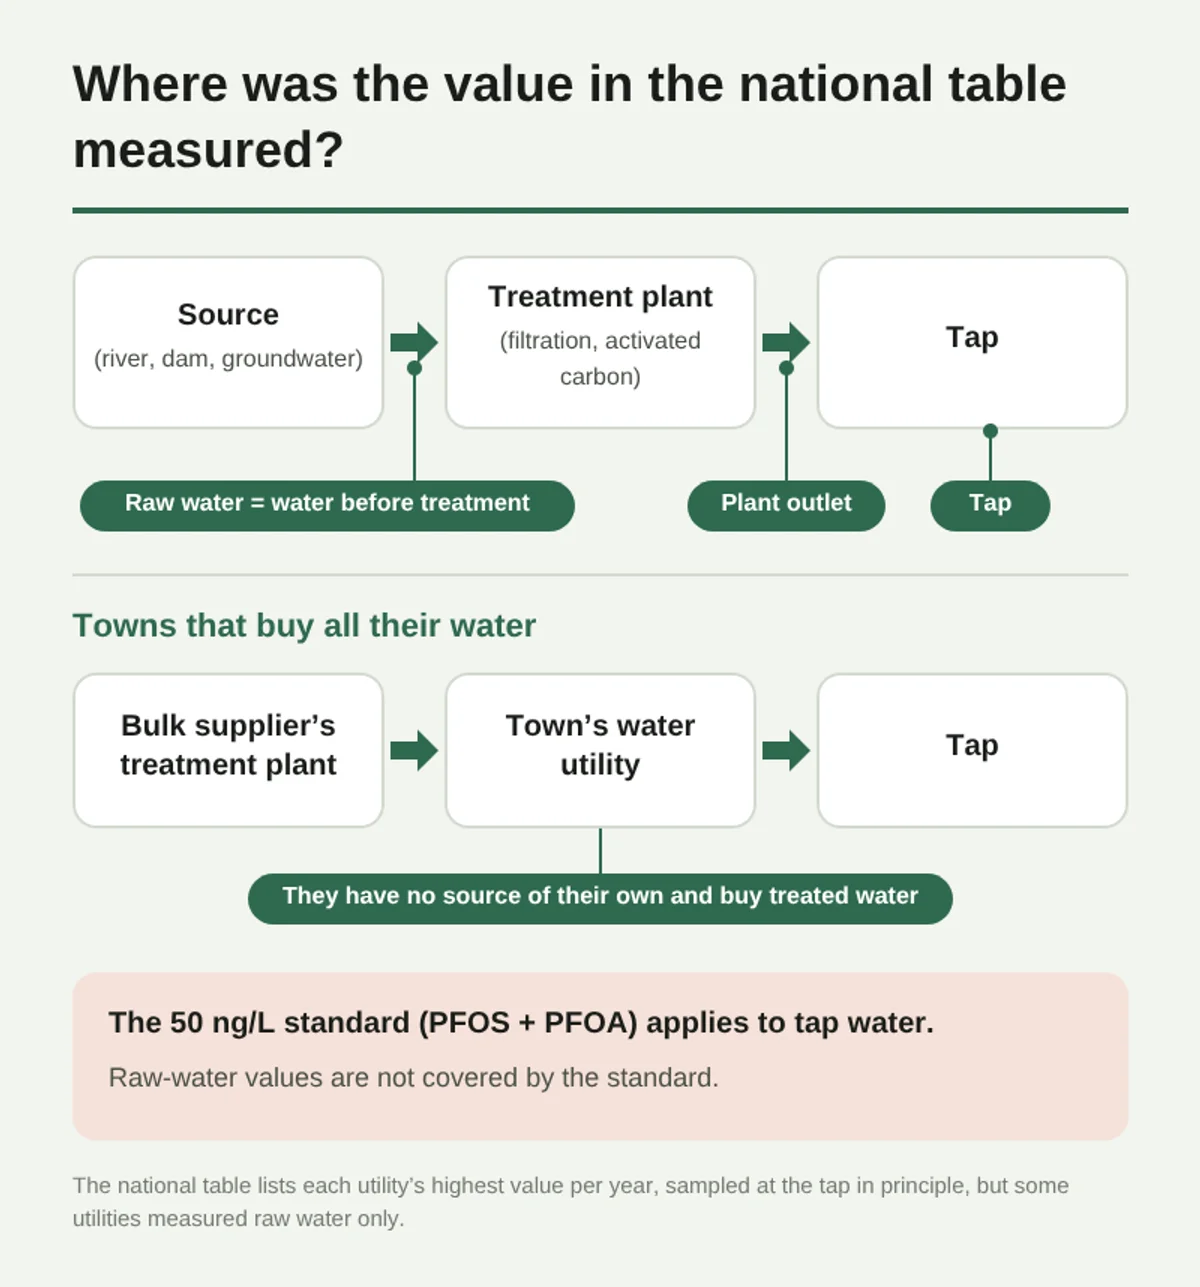
- Values are PFOS and PFOA combined. Samples are taken at the tap in principle, but some utilities only measured raw water (water before treatment). Raw-water values are not covered by the standard, so they are shown in a different colour.
- A utility that “buys all its water” has its source and treatment plant at the bulk supplier. Check the supplier’s values too (how to check).
- 50 assumes drinking the water for a lifetime. At 2 L a day and 50 kg body weight, 50 ng/L is 10% of the tolerable daily intake (TDI) and 10 ng/L is 2% (use the calculator below for your own numbers).
What this database adds
- The national table is an Excel sheet sorted by utility name. Urayomi made it searchable by prefecture and city, and for utilities that buy all their water, linked them to their bulk supplier.
- You can convert your local value into “% of TDI” and “times the intake from food” from how much you drink and your body weight, and see how the reading changes with the yardstick (Japan’s TDI vs EFSA’s TWI).
- If you want to reduce intake, water filter ratings (makers’ published PFOS/PFOA volumes and the test conditions) are in the same database. River and groundwater values are kept separate from tap water.
Browse by prefecture
For each of the 47 prefectures: values by utility and year, local government data, and what happened at utilities that exceeded 50.
| Prefecture | Utilities | Highest FY2020–25 | Highest FY2025 | Utilities above 50 |
|---|---|---|---|---|
| HokkaidoThe FY2020–2025 maximum was 47 ng/L at the Mukawa Town Hobetsu small water supply system (むかわ町穂別簡易水道) (FY2024, tap). No utility exceeded 50 | 278 | 47むかわ町穂別簡易水道事業(2024) | 34 | — |
| Aomori PrefectureThe FY2020–2025 maximum was 5 ng/L in Kuroishi City (黒石市) (FY2024 and FY2025, tap). Almost all results are nd | 59 | 5黒石市水道事業(2025) | 5 | — |
| Iwate PrefectureThe FY2020–2025 maximum was 6 ng/L in Ichinoseki City (一関市) (FY2024 and FY2025). Everything else was nd | 48 | 6一関市上下水道事業(2025) | 6 | — |
| Miyagi PrefectureThe FY2020–2025 maximum was 13 ng/L in Tagajo City (多賀城市) (FY2021). nd since FY2022 | 40 | 13多賀城市(2021) | 2 | — |
| Akita PrefectureThe FY2020–2025 maximum was 38 ng/L in Yurihonjo City (由利本荘市) (FY2024, a raw water value) | 119 | 38由利本荘市水道事業(2024) | 37 | — |
| Yamagata PrefectureThe FY2020–2025 maximum was 35 ng/L in Higashine City (東根市) (FY2024). 24 in FY2025 | 60 | 35東根市水道事業(2024) | 24 | — |
| Fukushima PrefectureThe FY2020–2025 maximum was 12 ng/L in Bandai Town (磐梯町) (FY2024). The main cities were all nd | 86 | 12磐梯町水道事業(2024) | 11 | — |
| Ibaraki PrefectureThe FY2020–2025 maximum was 37 ng/L at the Koda-Higashi small water supply association (国府田東簡易水道組合) (FY2025). No utility exceeded 50 | 152 | 37国府田東簡易水道組合(2025) | 37 | — |
| Tochigi PrefectureThe FY2020–2025 maximum was 66 ng/L in Shimotsuke City (下野市) (FY2024). 63 in FY2025; the city set up temporary water distribution points | 30 | 66下野市水道事業(2024) | 63 | 1 |
| Gunma PrefectureThe FY2020–2025 maximum was 64 ng/L in Shibukawa City (渋川市) (FY2022; measured at the tap and in raw water). The city responded by reducing the pumping rate of a well | 139 | 64渋川市水道事業(2022) | 50 | 1 |
| Saitama PrefectureThe FY2020–2025 maximum was 49 ng/L in Fujimi City (富士見市) (FY2023). 43 in Fukaya City (深谷市) in FY2025 | 60 | 49富士見市水道事業(2023) | 43 | — |
| Chiba PrefectureThe FY2020–2025 maximum was 36 ng/L in Yachimata City (八街市) (FY2021). The FY2025 maximum was 11 | 46 | 36八街市水道事業(2021) | 11 | — |
| TokyoThe maximum was 64 ng/L at the Tokyo Metropolitan Waterworks Bureau (東京都水道局) (FY2020). That same year a tap in Kodaira City (小平市) measured 64, and Tokyo stopped its high-concentration wells. The FY2025 maximum was 12 | 14 | 64東京都水道局(2020) | 12 | 1 |
| Kanagawa PrefectureThe maximum was 63 ng/L in Zama City (座間市) (FY2020). Yokohama City, Kawasaki City and the prefectural waterworks were nd for all six years | 34 | 63座間市上下水道局(2020) | 18 | 1 |
| Niigata PrefectureThe FY2020–2025 maximum was 10 ng/L in Tokamachi City (十日町市) (FY2025, tap). Almost all results are nd | 116 | 10十日町市(2025) | 10 | — |
| Toyama PrefectureThe FY2020–2025 maximum was 7 ng/L in Takaoka City (高岡市) (FY2023, tap). In FY2024 and FY2025, every result in the prefecture was nd | 59 | 7高岡市水道事業(2023) | nd | — |
| Ishikawa PrefectureThe FY2020–2025 maximum was 40 ng/L at the Fukudome Green City small water supply system (福留グリーンシティー簡易水道) (FY2025). Kanazawa City was nd | 91 | 40福留グリーンシティー簡易水道(2025) | 40 | — |
| Fukui PrefectureHighest in FY2020–FY2025: 19 ng/L at the Awara Onsen Water Supply Property District (FY2024). No supplier exceeded 50 | 105 | 19芦原温泉上水道財産区水道事業(2024) | 14 | — |
| Yamanashi PrefectureHighest in FY2020–FY2025: 21 ng/L in Hokuto City (FY2024, raw water). No supplier exceeded 50 | 136 | 21北杜市上下水道事業者(2024) | 13 | — |
| Nagano PrefectureHighest in FY2020–FY2025: 58 ng/L in Nagano City (FY2020, tap). 4 in FY2025 | 178 | 58長野市水道事業(2020) | 11 | 1 |
| Gifu PrefectureHighest in FY2020–FY2025: 550 ng/L in Kakamigahara City (FY2021). 20 in FY2025 after activated carbon treatment | 94 | 550各務原市水道事業(2021) | 33 | 1 |
| Shizuoka PrefectureHighest in FY2020–FY2025: 20 ng/L at the Yamauchi small water supply system (FY2025). No supplier exceeded 50 | 143 | 20山内簡易水道(2025) | 20 | — |
| Aichi PrefectureHighest in FY2020–FY2025: 175 ng/L at the Kitanagoya Water Supply Authority (FY2020, raw water). nd since FY2022 | 48 | 175北名古屋水道企業団(2020) | 42 | 1 |
| Mie PrefectureHighest in FY2020–FY2025: 290 ng/L in Kuwana City (FY2020, tap). nd since FY2023 | 56 | 290桑名市上下水道部(2020) | 17 | 1 |
| Shiga PrefectureHighest in FY2020–FY2025: 30 ng/L in Ritto City and Moriyama City. No supplier exceeded 50 | 30 | 30栗東市上下水道事業所(2022) | 19 | — |
| Kyoto PrefectureHighest in FY2020–FY2025: 75 ng/L in Fukuchiyama City (FY2023, tap). Three suppliers exceeded 50 | 32 | 75福知山市上下水道部(2023) | 61 | 3 |
| Osaka PrefectureHighest in FY2020–FY2025: 73 ng/L on the Tawara treatment plant line in Shijonawate (FY2020; plant since closed). Sakai City taps: 7–10 (FY2026) | 43 | 73大阪広域水道企業団四條畷水道事業(2020) | 27 | 1 |
| Hyogo PrefectureHighest in FY2020–FY2025: 100 ng/L in Nishiwaki City (FY2021, tap). 69 at the Tai Small Water Supply Association in FY2025 | 53 | 100西脇市(2021) | 69 | 3 |
| Nara PrefectureHighest in FY2020–FY2025: 46 ng/L at the Yamazoe Village small water supply system (FY2023, raw water). No supplier exceeded 50 | 42 | 46山添村簡易水道事業(2023) | 21 | — |
| Wakayama PrefectureHighest in FY2020–FY2025: 32 ng/L in Iwade City (FY2023). No supplier exceeded 50 | 78 | 32岩出市(2023) | 22 | — |
| Tottori PrefectureHighest in FY2020–FY2025: 24 ng/L in Yonago City (FY2020 and FY2022). No supplier exceeded 50 | 22 | 24米子市水道事業(2022) | 19 | — |
| Shimane PrefectureHighest in FY2020–FY2025: 20 ng/L in Unnan City (FY2025). No supplier exceeded 50 | 24 | 20雲南市水道事業(2025) | 20 | — |
| Okayama PrefectureHighest in FY2020–FY2025: 1,400 ng/L in Kibichuo Town (FY2022), the highest value among water suppliers nationwide. nd since FY2024 | 64 | 1400吉備中央町(2022) | 22 | 1 |
| Hiroshima PrefectureHighest value in FY2020–FY2025: 40 ng/L for the Akitakata City water service (FY2024). No water utility exceeded 50 | 25 | 40広島県水道広域連合企業団安芸高田市水道事業(2024) | 23 | — |
| Yamaguchi PrefectureHighest value in FY2020–FY2025: 32 ng/L in Hofu City (FY2020). It fell every year, to 8 in FY2025 | 25 | 32防府市水道事業(2020) | 8 | — |
| Tokushima PrefectureHighest value in FY2020–FY2025: 14 ng/L in Awa City (FY2024). Every value in the prefecture was 14 or below | 50 | 14阿波市水道事業(2024) | 7 | — |
| Kagawa PrefectureThe national table has only 2 rows: the Kagawa Prefecture Wide-Area Water Supply Authority and Naoshima Town. Highest: 36 ng/L for the authority (FY2025, through August) | 2 | 36香川県広域水道企業団水道事業(2025) | 36 | — |
| Ehime PrefectureHighest value in FY2020–FY2025: 25 ng/L for the Nakajima District small water supply system in Matsuyama City (FY2024). None exceeded 50 | 87 | 25中島地区簡易水道事業(松山市公営企業局)(2024) | 8 | — |
| Kochi PrefectureHighest value in FY2020–FY2025: 26 ng/L in Kuroshio Town (FY2025). None exceeded 50 | 37 | 26黒潮町水道事業(2025) | 26 | — |
| Fukuoka PrefectureHighest value in FY2020–FY2025: 48 ng/L in Miyama City (FY2023). A private water supply at JASDF Ashiya Air Base had 1,500 | 68 | 48みやま市水道事業(2023) | 33 | — |
| Saga PrefectureHighest value in FY2020–FY2025: 15 ng/L in Genkai Town (FY2023). Every value in the prefecture was 15 or below | 52 | 15玄海町上下水道事業(2023) | 13 | — |
| Nagasaki PrefectureHighest value in FY2020–FY2025: 48 ng/L in Shinkamigoto Town (FY2024, raw water). No utility exceeded 50 | 53 | 48新上五島町水道事業(2024) | 47 | — |
| Kumamoto Prefecture95 ng/L at a water source in the Shiranui Tobu District of Uki City (FY2024). The distribution system was switched; finding the cause is “difficult” | 112 | 95不知火東部地区簡易水道事業(2024) | 43 | 1 |
| Oita PrefectureHighest value in FY2020–FY2025: 28 ng/L in Kunisaki City (FY2024). Oita City’s tap water has been nd in every year since FY2021 | 57 | 28国東市水道事業(2024) | 26 | — |
| Miyazaki Prefecture61 ng/L in Kobayashi City’s tap water (FY2025). The city switched to a different water source | 76 | 61小林市水道事業(2025) | 61 | 1 |
| Kagoshima PrefectureHighest value in FY2020–FY2025: 29 ng/L in Higashikushira Town (FY2025). None exceeded 50 | 112 | 29東串良町水道事業(2025) | 29 | — |
| Okinawa PrefectureHighest: 70 ng/L in Kin Town (FY2020). Treated water from the Chatan treatment plant: max 6 in FY2026 (Enterprise Bureau) | 41 | 70金武町水道事業(2020) | 9 | 1 |
“Highest FY2020–25” is the highest of the yearly maximums of utilities in the prefecture (including raw-water-only values). “Utilities above 50” counts utilities with a year above 50 ng/L (including raw water; not necessarily a breach of the standard). FY2025 runs to the end of August.
Put it in terms of your own intake
Enter the tap water level, your body weight and how much you drink a day to see the share of Japan’s TDI and EFSA’s TWI, and the ratio to intake from food.
- Intake from water
- — ng/kg/day
- Compared with Japan’s tolerable daily intake (PFOS and PFOA, 20 ng/kg bw/day each)
- —
- Compared with EFSA’s tolerable weekly intake (4 PFAS combined, 4.4 ng/kg bw/week ≈ 0.63 a day)
- —
- Compared with intake from 37 foods (MAFF estimate: PFOS 0.13 + PFOA 0.09 = 0.22 ng/kg bw/day; the 37 foods make up about half of what people eat by amount)
- —
The combined value is treated as a single substance (in reality it is split between PFOS and PFOA, so the share of Japan’s TDI would be smaller). EFSA’s value is for the sum of PFOA, PFNA, PFHxS and PFOS; tap-water values here do not include PFNA or PFHxS. This calculation shows how the same intake reads differently against different yardsticks; it does not judge health effects.
Distribution of values nationwide
Utilities in the national table (December 2025), grouped by level each year.
Utilities above 50 ng/L
Includes values measured in raw water only.
Standards around the world
Countries count different numbers of substances (2 to 48, or total PFAS) and differ in legal force, so the numbers cannot be compared by size alone.
Common questions
Only what government documents and papers show
Main sources
- Ministry of the Environment, press release on the follow-up survey of PFOS and PFOA in water supplies (25 Dec 2025) and results table (Excel)
- Ministry of the Environment, results of the survey of PFOS and PFOA in water supplies (29 Nov 2024)
- Ministry of the Environment, final summary of the same survey (24 Dec 2024)
- MLIT, cases of PFOS and PFOA responses by water utilities (29 Nov 2024)
- Ministry of the Environment, outline of the revised ordinance on water quality standards
- Food Safety Commission of Japan, Q&A on the PFAS risk assessment
- Ministry of the Environment, FAQ on PFAS
- MAFF, Q&A on PFAS (intake from 37 domestic foods)
Last checked 2026.10.04 (against the original government documents and papers, collected and cross-checked in Gemini Notebook). Utility values are as in the national table; Urayomi sorted and summarized them.