

Which foods raise the risk of stomach cancer? Salt, H. pylori, wheat, and charred grilled fish, checked against national evaluations and studies

PR This article contains affiliate links to Rakuten Ichiba, Amazon, Yahoo! Shopping, and A8.net (“See on Rakuten”, etc.). What it says is based on official sources and published studies, regardless of whether there are ads.
Stomach cancer is common in Japan. About 105,000 people were newly diagnosed with stomach cancer in 2023, and about 38,000 died of it in 2024 (National Cancer Center Japan, Cancer Statistics).
You hear many claims about stomach cancer and food.
- “The foods that raise stomach cancer risk are the salty ones”
- “Eating bread or ramen (wheat) gives you stomach cancer”
- “Tarako (salted pollock roe), mentaiko (spicy cod roe), shiokara (salted fermented seafood), and tsukemono (pickles) cause stomach cancer”
- “Eating the charred parts of grilled fish gives you stomach cancer”
- “Hot tea is bad for the stomach”
- “Green tea and miso soup protect against stomach cancer”
- “Japanese people get a lot of stomach cancer because of their diet”
- “Stomach cancer is increasing in young women”
This article checks the following:
- What causes stomach cancer, and how large is the effect of food compared with other causes
- Which foods raise or lower the risk of stomach cancer, and whether the national and international evaluations agree
- Whether wheat (bread and noodles) increases stomach cancer, tracing the studies behind the national evaluation “grains = possible”
- Whether the salt in ramen and udon is in the noodles or in the broth
- Charred grilled fish, hot drinks, miso soup, and green tea
- Why stomach cancer is common in Japan and why it has declined, and stomach cancer in young people and women
- How much the measures that matter more than diet (H. pylori eradication and stomach cancer screening) actually help
We check these against the evaluations of the National Cancer Center Japan, the World Cancer Research Fund, and the International Agency for Research on Cancer (IARC), plus published studies and national statistics. For wheat and colorectal cancer, see our article on wheat flour and cancer. For the target salt intake and ways to cut salt, see our article on salt intake.
This article is not a substitute for diagnosis or treatment. If you have ongoing stomach trouble or any symptom that worries you, see a gastroenterologist.
Conclusion
- The biggest cause of stomach cancer is H. pylori (Helicobacter pylori). The National Cancer Center Japan rates it “convincing” as a cause, and also rates “convincing” that eradication lowers the risk. A 2015 estimate attributes about 90% of stomach cancers on the outlet side of the stomach (non-cardia) to H. pylori
- The foods said to raise risk at the “probable” level are salt and salted foods. The research centers on foods preserved in salt, such as tarako, mentaiko, shiokara, tsukemono, and salted fish. However, the World Cancer Research Fund (WCRF) rates it a little differently: “probable” for salt-preserved foods and “no conclusion” for total salt
- It cannot be said that wheat (bread and noodles) increases stomach cancer. The national evaluation “grains = possible” rests on 5 papers, and the only grain named in their abstracts was rice. A 2026 pooled analysis of 20 studies worldwide found 1.39 times the risk for the highest intake of refined grains (white rice, pasta, white bread), but in Asian studies alone it was 1.13 times, and the difference was not clear
- If you are going to watch something in noodle dishes, watch the broth, not the noodles. Wheat flour itself has 0 g of salt. Of the salt in one cup of instant noodles (4.6 to 5.1 g), 46 to 59% was in the soup. The National Cancer Center Japan also says not to finish all of the broth in noodle dishes
- Evidence in humans that charred grilled fish causes stomach cancer is weak. The international evaluation rests on 3 old Japanese studies whose results do not agree, and it is not an evaluation item in the national assessment. It is the esophagus, not the stomach, where “hot” food and drink raise risk
- On the lowering side, vegetables and fruit are rated “possible”. For green tea, women who drank 5 or more cups a day had 21% less stomach cancer, while men showed no difference. For miso soup, studies disagree
- Stomach cancer in Japan keeps declining. The age-adjusted death rate fell from 73.1 in 1960 to 9.7 in 2024, about 87% (per 100,000 people). The main reason is thought to be that people born more recently have lower H. pylori infection rates. In people in their 20s and 30s, the number of male and female patients is almost the same
- Bigger than diet are H. pylori eradication and stomach cancer screening. Most food differences are about 1.1 to 1.5 times, whereas for H. pylori the figure used in Japanese estimates is about 15 times (people with both infection and atrophic gastritis compared with people with neither). In randomized controlled trials, eradication reduced stomach cancer to 0.64 times. National stomach cancer screening is for ages 50 and over, every 2 years
Items featured in this article
| Item | When it is useful | Where in this article |
|---|---|---|
| Reduced-salt foods (reduced-salt soy sauce, reduced-salt miso, lower-salt instant noodles, etc.) | When you want to cut salt in soups, noodle dishes, and everyday seasoning | Choosing reduced-salt foods |
H. pylori testing and eradication and stomach cancer screening are not advertised here. Instead, they are covered under Bigger than diet: H. pylori eradication and stomach cancer screening with information on the national screening program and seeing a medical institution.
Causes of stomach cancer and a list of food evaluations
Based on studies of Japanese people, the National Cancer Center Japan rates the causes of stomach cancer mainly in the stages “convincing,” “probable,” “possible,” and “insufficient evidence” (new categories were also added from 2025). Here is the stomach cancer column of the May 2026 list.
| Factor | Evaluation | Relation to stomach cancer |
|---|---|---|
| H. pylori infection | Convincing increase in risk | The biggest cause of stomach cancer |
| Smoking | Convincing increase in risk | Smokers have about 1.6 times the risk of non-smokers (men 1.8 times, women 1.2 times) |
| H. pylori eradication | Convincing decrease in risk | Fewer stomach cancers in people who were treated |
| Salt and salt-preserved foods | Probable increase in risk | More in people who eat a lot of tarako, shiokara, tsukemono, salted fish, etc. |
| Alcohol (men) | Probable increase in risk | Higher with larger amounts (1.09 to 1.29 times) |
| Grains | Possible (raises) | The grain named in the underlying papers is rice (details below) |
| Obesity | Possible (raises) | Cancer in the part near the entrance of the stomach (cardia) |
| Vegetables and fruit | Possible (lowers) | Tends to be lower in people who eat more |
| Green tea (women) | Possible (lowers) | 21% lower with 5 or more cups a day |
| Meat, fish, milk, dairy products, isoflavones, vitamins, fat, dietary patterns, diabetes, passive smoking, alcohol (women), green tea (men) | Insufficient evidence | Not enough studies to make a judgment |
| Soy, coffee, hot food and drink, dietary fiber, etc. | Not evaluated for stomach cancer | Hot food and drink are rated “probable” for increasing risk of “esophageal cancer” |
| Grilled fish, charred parts | Not an evaluation item | ― |
Source: National Cancer Center Japan, “Research on Cancer Risk Evaluation and Cancer Prevention Guideline Recommendations Based on Scientific Evidence,” evaluation list (version of May 26, 2026).
- Evaluations are revised from time to time. For example, “H. pylori eradication = convincing decrease” was added in November 2020 and “alcohol (men) = probable” in March 2022
- The Center itself writes that “for diet, for most foods and nutrients the data are still insufficient.” It also explains that because Japanese people differ little in diet from one another, the effect of foods may appear smaller than it really is
Some evaluations differ between Japan and the world
Besides the National Cancer Center Japan, the World Cancer Research Fund and American Institute for Cancer Research (WCRF/AICR, an international evaluation of diet and cancer) and the International Agency for Research on Cancer (IARC) of the World Health Organization also publish evaluations of stomach cancer and food. The same food does not always get the same rating.
| Factor | National Cancer Center Japan | WCRF/AICR (2016, revised 2018) | IARC |
|---|---|---|---|
| Salt and salt-preserved foods | Probable increase | Salt-preserved foods: probable increase. Total salt: no conclusion | Traditional Asian pickled vegetables and Chinese-style salted fish: “limited evidence” |
| Grains | Possible (raises) | Grains and their products: no conclusion | ― |
| Alcohol | Probable increase in men | About 45 g or more a day: probable increase | Stomach is not on the list |
| Grilled meat and fish | Not an evaluation item | Limited-suggestive (based on 3 Japanese studies) | Substances formed in charred food (PhIP, etc.) are “possibly carcinogenic” (2B) |
| Processed meat | Meat: insufficient evidence | Limited-suggestive for the outlet side of the stomach | Stomach: “limited evidence” (colorectum: sufficient) |
| Vegetables and fruit | Possible (lowers) | Low fruit intake: limited-suggestive for raising risk. Vegetables: no conclusion | ― |
| Green tea | Possible (lowers) in women | No conclusion | ― |
For grains and stomach cancer, WCRF/AICR writes that “there is no new evidence since the 2007 report, so the conclusion remains none.” “Grains = possible,” which is the most likely source of the “wheat causes stomach cancer” claim, is a rating found only in Japan’s evaluation.
What causes stomach cancer? The biggest is H. pylori
H. pylori is “convincing,” and so is eradication
H. pylori is a bacterium that lives in the lining of the stomach. The IARC classifies it as “carcinogenic to humans” (Group 1), and the National Cancer Center Japan rates it as a “convincing increase in risk.”
According to the National Cancer Center Japan:
- In one Japanese study, people who developed stomach cancer were about 5 times as likely to be infected with H. pylori as those who did not
- Most infections are thought to occur by about age 5. The main routes are thought to be sharing chopsticks or spoons within the family and feeding children food premasticated by an adult
- Thanks to better sanitation after the war, infection rates in younger generations have fallen sharply (infection rates differ by birth year)
An estimated 90% of stomach cancers in Japan are due to H. pylori
Researchers at the National Cancer Center Japan and elsewhere estimated how much of Japan’s cancer in 2015 was due to each cause (Lin et al. 2021).
- For stomach cancer on the outlet side (non-cardia), 89% in men and 90% in women were estimated to be due to H. pylori
- The calculation used a relative risk of 15 for cancer on the outlet side (the value from a Japanese meta-analysis comparing people with both H. pylori infection and atrophic gastritis against people with neither) and 2 for the entrance side (cardia)
The “about 90%” is an estimate for cancer on the outlet side. Note that it is not the share of all stomach cancers.
The effect of food is “1.1 to 1.5 times”; for H. pylori (with atrophic gastritis) it is “about 15 times”
Lining up the “how many times” figures from the studies, most of the differences from food fall in the range of 1.1 to 1.5 times. That is an order of magnitude apart from the roughly 15 times for H. pylori (people with both infection and atrophic gastritis compared with people with neither).
| Factor | How many times | Study |
|---|---|---|
| H. pylori infection + atrophic gastritis (outlet side of the stomach) | About 15× | Value from a Japanese meta-analysis comparing people with both against people with neither; the value used in the estimate (Lin 2021) |
| Smoking | 1.6× (men 1.8, women 1.2) | Meta-analysis of Japanese studies (10 follow-up studies, 16 case-control studies) |
| Family history of stomach cancer | 1.44× | 12 Asian follow-up studies, about 550,000 people |
| Eating a lot of salted fish | 1.43× in men, 1.33× in women | Japanese follow-up study (JPHC, about 90,000 people) |
| Eating a lot of refined grains | 1.39× (1.13× in Asia alone, not significant) | Pooled analysis of 20 case-control studies worldwide (StoP) |
| Alcohol (men, 92 g or more of ethanol a day) | 1.29× | 6 Japanese follow-up studies, about 256,000 people |
| Green tea (women, 5 or more cups a day) | 0.79× | 6 Japanese follow-up studies, about 200,000 people |
| H. pylori eradication | 0.64× | Meta-analysis of 8 randomized controlled trials (Ford 2025) |
A few terms:
- Follow-up (cohort) study: a study that first surveys the diet etc. of healthy people, follows them for years, and counts who develops the disease
- Case-control study: a study that asks people with the disease and people without it to recall their past diet and compares the two. It is prone to recall bias
- Randomized controlled trial (RCT): a trial that divides people into groups by lottery and gives a treatment, etc., to only one group. It is the strongest design for establishing cause and effect
Body size (BMI) has also been summarized in Asian studies (about 540,000 people): risk was 15% higher for the underweight (BMI under 18.5) and 12% higher for the overweight (27.5 or more). In that analysis, the effect of high BMI was seen on the outlet side of the stomach, not on the cardia as in the national evaluation, and H. pylori was not taken into account. Diabetes was also associated with 15% higher risk, but the national evaluation remains “insufficient evidence.”
Which foods raise the risk of stomach cancer? Salt and salt-preserved foods
What is “probable” is foods preserved in salt
What Japan rates “probable” is salt and salt-preserved foods (foods preserved with salt). The foods in which Japanese studies saw an association are as follows.
| Study | Subjects | Findings |
|---|---|---|
| JPHC study (Tsugane 2004, as introduced by the National Cancer Center Japan) | Japanese follow-up study | In men, more with more salt. In both sexes, a tendency toward more cancer in people who eat a lot of high-salt foods such as salmon roe (ikura), shiokara, and neri-uni (salted sea urchin paste) |
| JPHC study (Takachi 2010) | Japanese follow-up study | In people who eat a lot of salt-preserved foods such as tsukemono, salted fish, and salted fish roe, more cancer overall and more stomach cancer |
| JPHC study (Hirabayashi 2024) | About 90,000 people over an average of 15 years, 2,701 stomach cancers | People in the top fifth for salted fish had 1.43 times (men) and 1.33 times (women) the risk of those in the bottom fifth |
| JACC study (Umesawa 2016) | About 40,000 people over about 14 years, 787 stomach cancers | 1.31 times in people who like a very salty taste. 1.67 times for 3 bowls of miso soup a day, 1.64 times for 4 or more |
| Korean studies and pooled analysis (Yoo 2020) | 2 Korean follow-up studies + meta-analysis | 1.15 times for every 40 g of pickles a day |
In Hirabayashi 2024, the association weakened once H. pylori infection and atrophic gastritis (a state in which the stomach lining has thinned because of H. pylori and other causes) were taken into account. Salt and H. pylori may be working together. The mechanisms by which salt damages the stomach lining, as known from animal and cell experiments, are covered in our article on salt intake.
How much salt is in tarako, mentaiko, and tsukemono?
From the Standard Tables of Food Composition in Japan by MEXT, we pulled the salt equivalent (per 100 g) of foods named in the studies.
| Food | Salt equivalent (g per 100 g) |
|---|---|
| Karashi mentaiko (spicy cod roe) | 5.6 |
| Tarako (pollock roe, raw) | 4.6 |
| Sujiko (salmon roe in the membrane) | 4.8 |
| Umeboshi (salt-pickled plums) | 18.2 |
| Cucumber nukazuke (rice-bran pickles) | 5.3 |
| Takuan (salt-pressed daikon pickles) | 3.3 |
| Napa cabbage kimchi | 2.9 |
| Salted napa cabbage | 2.1 |
| Salted salmon (shiozake) | 1.8 |
| Dried split horse mackerel (himono, raw) | 1.7 |
| Koikuchi shoyu (regular soy sauce) | 14.5 |
| Rice miso (light-colored, salty type) | 12.4 |
Source: MEXT, Standard Tables of Food Composition in Japan (8th revised edition), 2023 Supplement. A single serving is often less than 100 g, so treat these as a rough guide.
“Total salt” versus “salt-preserved foods”
The World Cancer Research Fund (WCRF/AICR) rates salt-preserved foods as “probable” for increasing stomach cancer, while rating total salt and salt added at the table as “no conclusion”. In a pooled analysis of 25 case-control studies worldwide (StoP), too, people who like a salty taste had more cancer, but the calculated total sodium showed no clear difference (details in our article on salt intake).
In other words, what stands out in research is “foods preserved in salt” rather than “salt overall.” However, people who eat a lot of salt-preserved foods also eat a lot of salt, so the two have not been fully separated.
Do wheat, bread, and noodles increase stomach cancer?
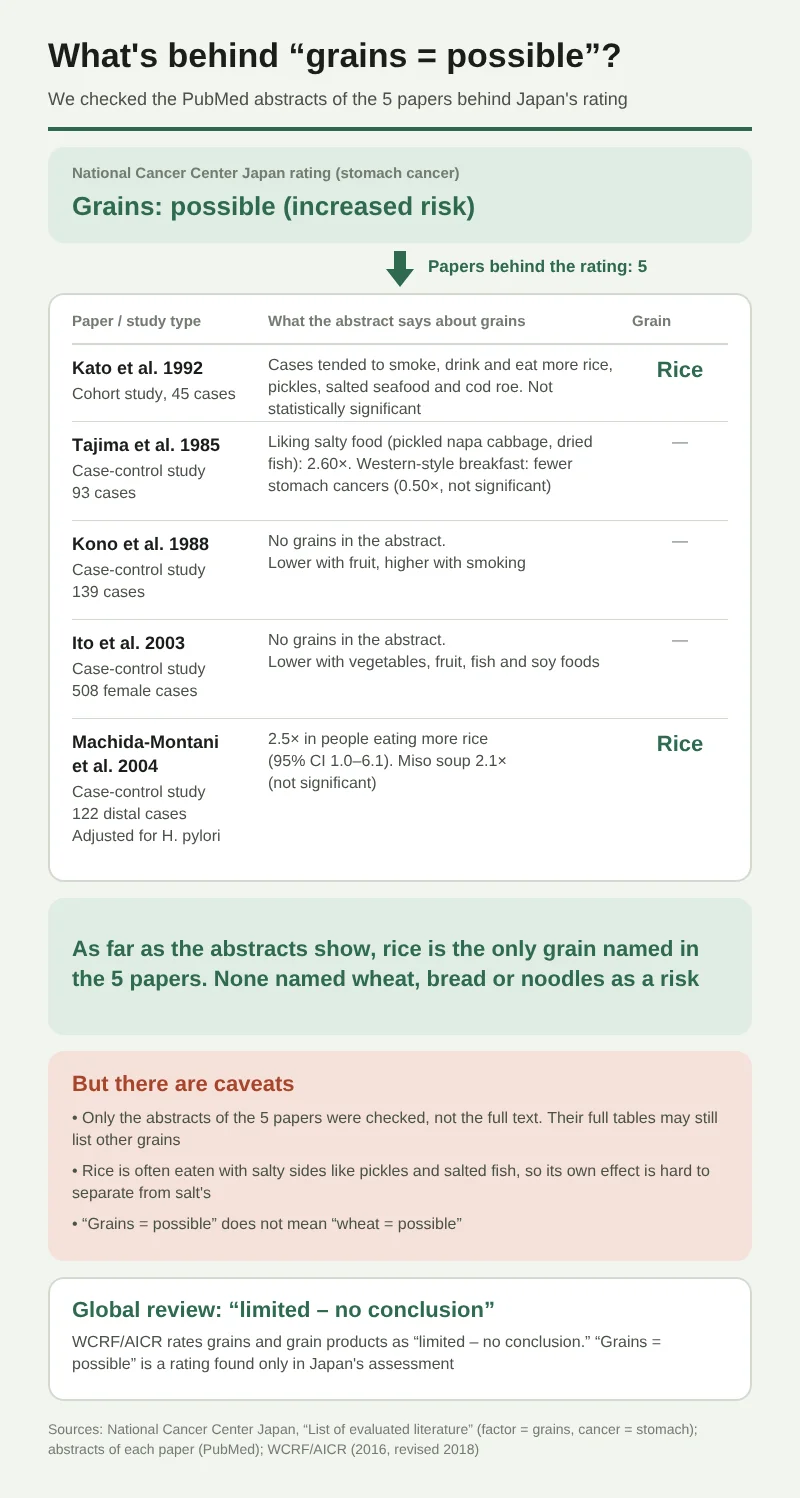
The national “grains = possible” rests on 5 papers, and the grain named is rice
The National Cancer Center Japan rates “grains” and stomach cancer as “possible (raises risk).” Tracing the papers behind this rating through the Center’s literature search turned up 5.
| Paper | Study type and size | What the abstract says about grains |
|---|---|---|
| Kato et al. 1992 | Follow-up study. 3,914 people who had a gastric endoscopy in Aichi Prefecture, followed an average of 4.4 years, 45 stomach cancers | People who developed stomach cancer tended to eat more tobacco, alcohol, rice, tsukemono, and shiokara and tarako. No statistically significant difference |
| Tajima et al. 1985 | Case-control study. Nagoya, 93 stomach cancers | 2.60 times in people who like a salty taste (pickled napa cabbage, dried fish). People who eat a Western-style breakfast were on the lower side for stomach cancer (0.50 times, not significant) |
| Kono et al. 1988 | Case-control study. Kitakyushu, 139 stomach cancers | No mention of grains in the abstract. Lower with fruit, higher with smoking |
| Ito et al. 2003 | Case-control study. Aichi, 508 stomach cancers in women | No mention of grains in the abstract. Lower with vegetables, fruit, fish, and soy products |
| Machida-Montani et al. 2004 | Case-control study. Nagano, 122 cancers on the outlet side of the stomach. Adjusted for H. pylori infection | 2.5 times in people who eat a lot of rice (95% confidence interval 1.0 to 6.1). Miso soup 2.1 times (not significant) |
Source: National Cancer Center Japan “List of evaluated literature” (factor = grains, cancer = stomach cancer); abstracts of each paper (PubMed).
As far as the abstracts show, the only grain named in the 5 papers is “rice,” and no paper identified wheat, bread, or noodles as a risk. If anything, Western-style breakfasts such as bread fall on the lower side for stomach cancer.
There are caveats, though.
- Of the 5 papers, none could be checked beyond the abstract. It remains possible that a table in the full text has an entry for another grain
- Rice is often eaten with salty side dishes such as tsukemono and salted fish, so it is hard to separate the effect of rice itself from the effect of salt. The Japanese follow-up study (JPHC) paper also touches on this
- “Grains = possible” does not mean “wheat = possible”
Pooled studies worldwide: 1.39 times for refined grains, but not clear in Asia
In 2026, the largest analysis of grains and stomach cancer was published. It is by Turati et al. of the StoP Project, a worldwide group of stomach cancer studies.
- Subjects: 20 case-control studies (8 in Europe, 4 in Asia = 3 in China and 1 in Japan, 2 in North America, 6 in Central and South America). 7,943 people with stomach cancer and 19,729 without
- “Refined grains” is the total of white rice, pasta, white bread, and so on. Results for wheat alone or rice alone were not reported
- People were divided into three groups by amount eaten, and the highest group was compared with the lowest
- Funding included the Italian Association for Cancer Research. The authors declare no conflicts of interest
| Condition | Highest third of refined grain intake |
|---|---|
| Overall (20 studies) | 1.39 times |
| Including grain-based sweets such as cakes and cookies (17 studies) | 1.52 times |
| The 11 studies that could adjust for total energy intake (total amount eaten) | 1.21 times |
| The 10 studies that could also adjust for H. pylori infection | 1.39 times |
| Europe | 1.34 times |
| Asia (China 3, Japan 1) | 1.13 times (not significant) |
| The Americas | 1.54 times |
| Studies using hospital patients as controls | 1.53 times |
| Studies using local residents as controls | 1.30 times |
What this table shows:
- Adjusting for total amount eaten shrank 1.39 times to 1.21 times. People who eat a lot of refined grains may simply eat more overall
- In the 4 Asian studies, refined grains (staple foods only) showed no clear difference. However, when sweets were included, even Asia (3 studies) showed a significant 1.38 times
- The effect was stronger in studies that used hospital patients as controls and weaker in those that used local residents. This shows that the numbers change with study design
- Salt, vegetables, fruit, smoking, and alcohol were adjusted for in studies that had the data (salt in 17 of 20). The authors discuss the possibility that “refined grains have a role that energy alone does not explain,” but because these are case-control studies they also note the possibility of recall bias
- The authors also point out that the diets of people who eat a lot of refined grains tend to be low in whole grains, fiber, vegetables, and fruit, and that whole and refined grains have a “more of one means less of the other” relationship. The refined grain numbers may therefore be mixed with differences in the whole diet
The original paper behind “36% more with refined grains”
The statement “people who eat a lot of refined grains have 36% more stomach cancer,” also presented in Urayomi’s article on wheat flour and cancer, comes from a 2020 meta-analysis by Chinese researchers (Wang et al.).
- 1.28 times for people who eat refined grains 1 to 2 times a week, and 1.63 times for 3 or more times a week
- The number of included studies is given as 16 in some places and 18 in others, depending on the paper describing it, so the accounts conflict. From the abstract, neither a distinction between rice and wheat nor whether salt was adjusted for could be read
- In another meta-analysis (Xu et al. 2019, 11 studies), grains overall were not associated with stomach cancer (1.11 times, not significant). The result of 1.65 times for refined grains comes from only 3 studies
- A 2025 umbrella review (Kim et al., a study collecting meta-analyses) recalculated the existing meta-analyses to get 1.36 times for refined grains, and concluded that in Asia alone “the amount of carbohydrate” was related
Whole grains are on the lower side, but not clear in follow-up studies
Whole grains (brown rice, whole wheat bread, etc.) are on the lower side for stomach cancer.
- Meta-analysis (Zhang et al. 2020, 11 studies): 0.64 times in people who eat a lot. However, 0.55 times in case-control studies and no significant difference in follow-up studies
- StoP (2026): 0.86 times in people who ate whole grains at or above the median. Changing the calculation method gave 0.87 times, which was no longer significant
- A paper summarizing studies on whole grains (Gaesser 2020) says “13 to 39% less with whole grains,” but it was funded by the American Bakers Association, and the author was a scientific advisor to a grain industry group
Whole wheat flour and colorectal cancer, and how to choose domestic whole wheat flour, are covered in our article on wheat flour and cancer.
In Japanese follow-up studies, wheat has not increased stomach cancer
Here are Japanese follow-up studies that looked at staple foods and stomach cancer.
| Study | Subjects | Findings |
|---|---|---|
| JACC study (Tokui et al. 2005) | Japanese follow-up study (stomach cancer deaths) | No relation between the amount of rice (now and in their 30s) and stomach cancer. Men who ate a Western-style breakfast (bread, etc.) had about half the stomach cancer deaths (0.49 times). 1.50 times in men who ate chagayu (tea porridge) for breakfast |
| JPHC study (Cai et al. 2022) | About 90,000 people over 17 years | 0.81 times for stomach cancer in people with a high low-carbohydrate diet score. Most carbohydrate for Japanese people is rice |
| JPHC study (Katagiri et al. 2021) | About 92,000 people, 2,228 stomach cancers | No relation between total dietary fiber and stomach cancer |
| Comparison of prefectures (Hara et al. 1984) | Statistics from 46 prefectures | Stomach cancer deaths were related to raw fish, salted and dried fish, salt, and special-grade sake. Bread showed up on the colon cancer side and not on the stomach cancer side |
- The JACC study’s “0.49 times with a Western-style breakfast” is a result adjusted for age only. Rather than bread protecting the stomach, it may reflect the difference from Japanese-style breakfasts (miso soup, tsukemono, salted fish, etc.)
- In this search, I did not find any Japanese study that tracked wheat, bread, ramen, and udon as separate items against stomach cancer
In Asia, a case-control study in Shanghai, China (Ji et al. 1998, 1,124 stomach cancers) found more stomach cancer in people who ate a lot of carbohydrate (1.5 times in men, 1.9 times in women), with a tendency toward more in people who often ate noodles and bread. However, the noodle and bread results did not reach a statistically meaningful difference (borderline at p=0.05 in women).
What can and cannot be said about wheat
| What can be said | What cannot be said |
|---|---|
| The grain named in the abstracts behind the national “grains = possible” rating is rice | “The government admits wheat causes stomach cancer” |
| In worldwide case-control studies, people who ate a lot of refined grains (white rice, pasta, and white bread combined) had 1.2 to 1.4 times the risk | “Wheat itself” increases stomach cancer (rice, bread, pasta, sweets, and overeating have not been separated) |
| In Asian studies alone, refined grains (staples) show no clear difference | “Giving up bread prevents stomach cancer” |
| Many studies put whole grains on the lower side (mostly case-control studies) | “Eating whole wheat flour prevents stomach cancer” |
| In Japanese follow-up studies, no result shows wheat or bread increasing stomach cancer | ― |
Allergies and celiac disease caused by wheat are covered in our article on diseases caused by wheat, and the check of the claim “wheat is bad for the body” is in our article on the wheat myth.
Does ramen or udon cause stomach cancer? The salt is in the broth, not the noodles
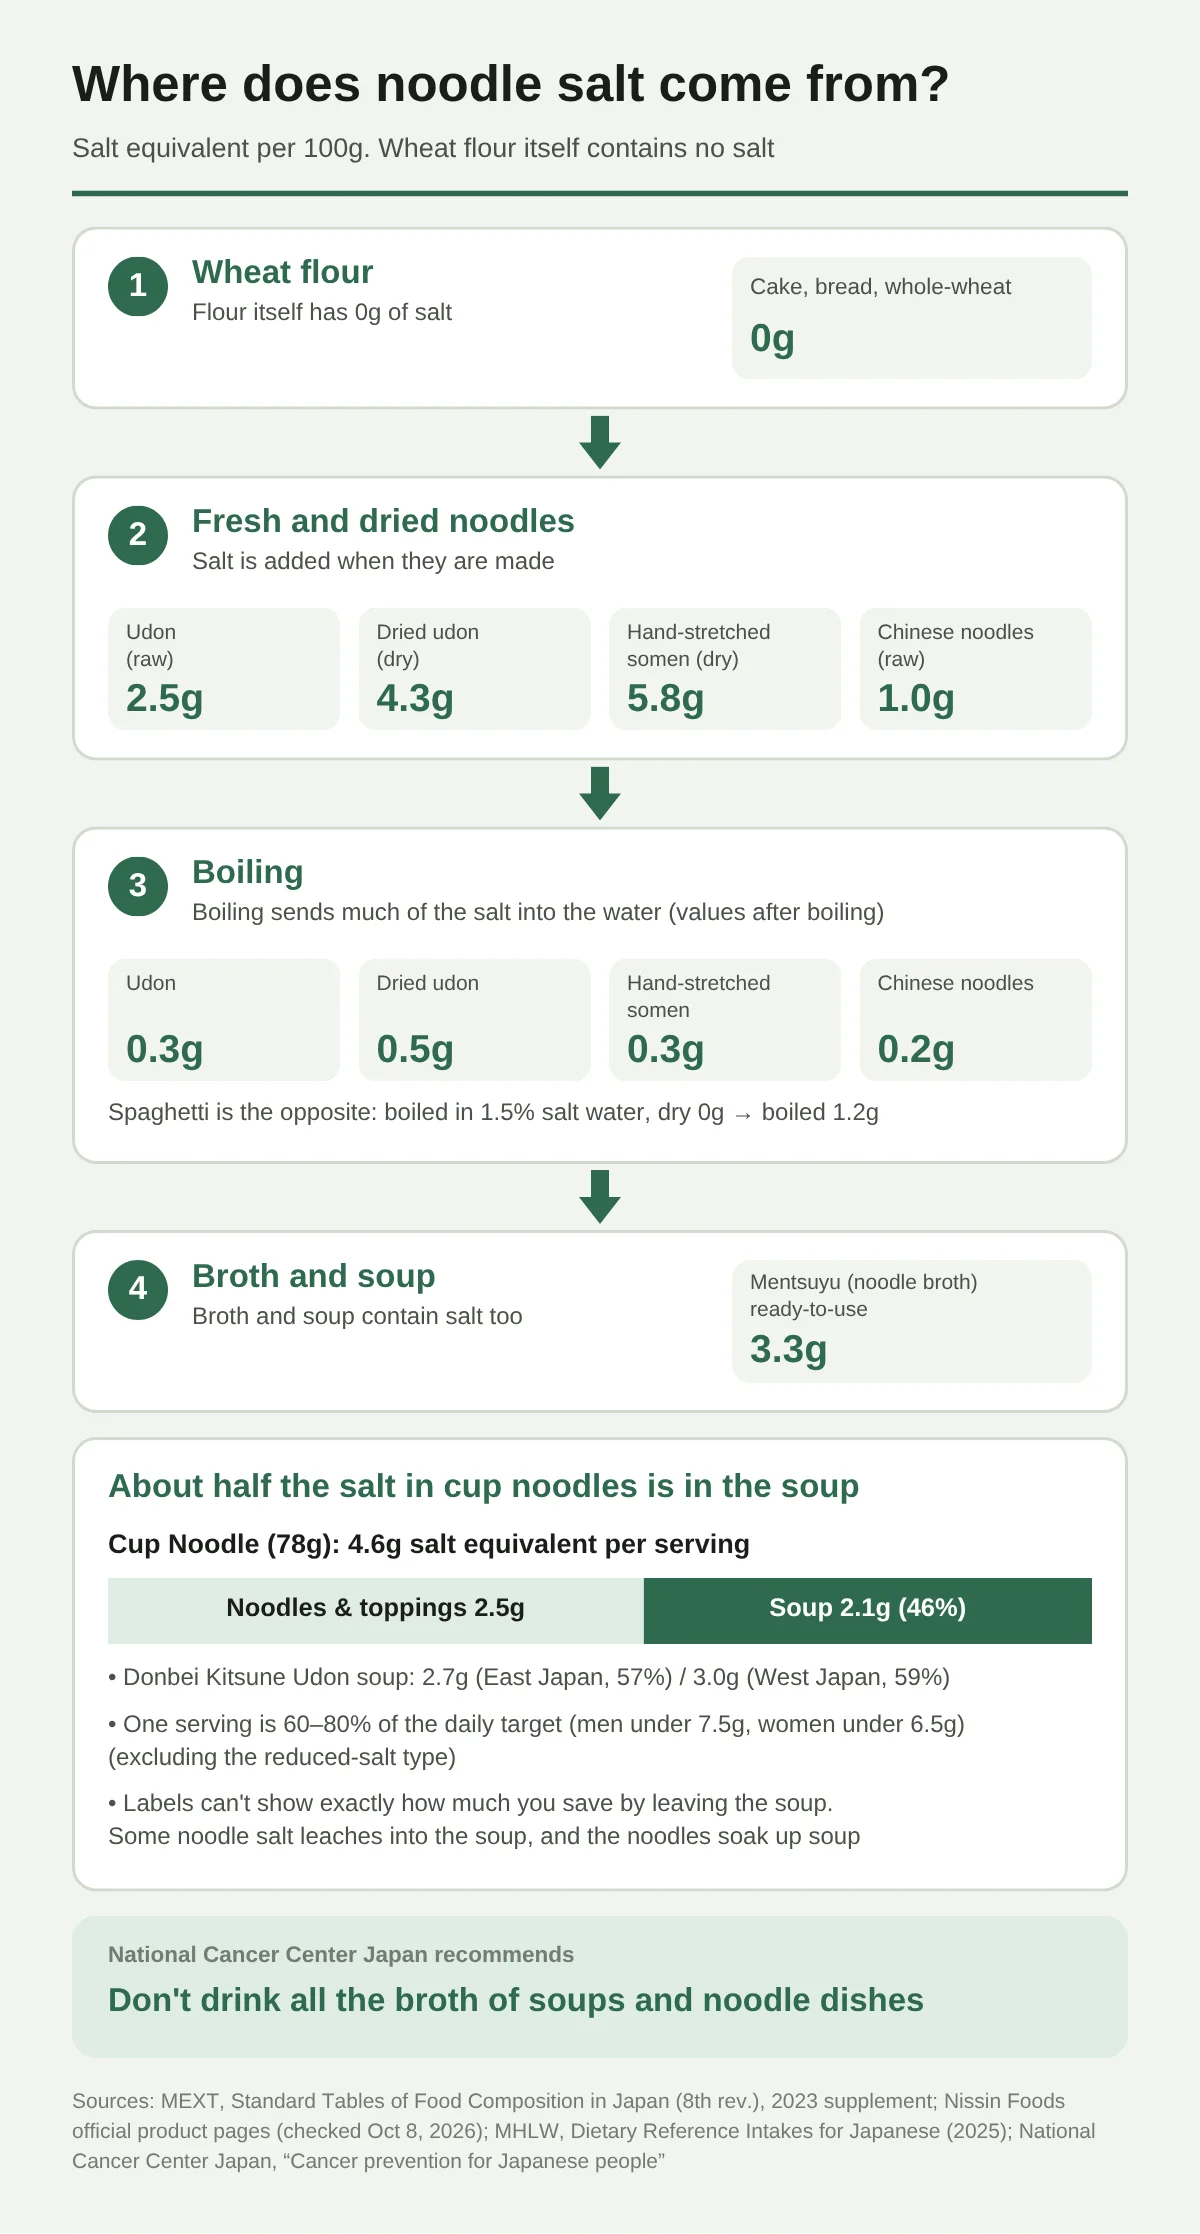
Wheat flour has 0 g of salt
Wheat flour itself contains no salt. Salt gets in when noodles and bread are made, and in the broth or soup.
| Food (per 100 g) | Salt equivalent (g) |
|---|---|
| Wheat flour (cake flour, bread flour, whole wheat flour) | 0 |
| Rice (polished) | 0 |
| Udon, raw → boiled | 2.5 → 0.3 |
| Dried udon → boiled | 4.3 → 0.5 |
| Dried hand-stretched somen → boiled | 5.8 → 0.3 |
| Chukamen (Chinese-style noodles), raw → boiled | 1.0 → 0.2 |
| Dried soba → boiled | 2.2 → 0.1 |
| Dried spaghetti → boiled | 0 → 1.2 (when boiled in 1.5% salt water) |
| Shokupan (sliced white bread, square loaf) | 1.2 |
| French bread | 1.6 |
| Whole wheat bread | 1.0 |
| Mentsuyu (noodle dipping sauce, ready-to-use) | 3.3 |
Source: MEXT, Standard Tables of Food Composition in Japan (8th revised edition), 2023 Supplement.
- Salt goes into raw and dried noodles when they are made, but most of it washes out into the water when they are boiled. Boiled udon has 0.3 g per 100 g, and boiled chukamen 0.2 g
- Pasta is the opposite: boiled in salted water, it has more salt after boiling than before
- Bread is baked with salt added to the flour, so it has 1 to 1.6 g per 100 g. At about 60 g per slice from a 6-slice loaf, that is about 0.7 g (Urayomi’s calculation)
Among the boiled noodles listed on Urayomi, the noodles in Taikoban Chuka Soba had 0.1 to 0.5 g of salt equivalent per 130 g serving (package label).
About half the salt in a serving of instant noodles is in the soup
Some instant noodles list the salt for “noodles and toppings” and “soup” separately in the nutrition label. We calculated from Nissin Foods’ official labels.
| One serving | Salt equivalent | Noodles and toppings | Soup | Share in soup |
|---|---|---|---|---|
| Cup Noodle (78 g) | 4.6 g | 2.5 g | 2.1 g | 46% |
| Donbei Kitsune Udon (for eastern Japan, 96 g) | 4.7 g | 2.0 g | 2.7 g | 57% |
| Donbei Kitsune Udon (for western Japan, 95 g) | 5.1 g | 2.1 g | 3.0 g | 59% |
| Cup Noodle PRO, Reduced Salt (75 g) | 3.1 g | 1.5 g | 1.6 g | 52% |
Source: official Nissin Foods product pages (confirmed October 8, 2026). The share in soup is Urayomi’s calculation.
- One serving of instant noodles is 60 to 80% of the daily target (under 7.5 g for men, under 6.5 g for women) (excluding the reduced-salt type). One Cup Noodle serving at 4.6 g is 61% of the men’s target, 71% of the women’s, and 92% of the WHO target (under 5 g)
- The western-Japan Donbei had 0.3 g more salt in the soup according to the labels (2.7 g east, 3.0 g west)
- The share in the soup is 46 to 59%, so about half of the salt is in the soup
With brothless noodles, you eat all of the sauce. For example, Nissin Dekauma Abura Soba was 6.2 g per serving (manufacturer’s label; no breakdown is given).
Concentrated mentsuyu is also on the salty side. Oigatsuo Tsuyu 2x was 5.7 g per 100 g before dilution (about 2.9 g per 100 g when diluted 2x as directed; Urayomi’s calculation). Few people drink all of the dipping sauce, but in dishes where you eat the broth along with the noodles, such as kake udon and kake soba, the amount of broth is directly the amount of salt.
How much less salt if you leave the broth?
The National Cancer Center Japan writes, for preventing stomach cancer, “do not drink all of the broth in soups and noodle dishes.”
However, how much is reduced by leaving the broth cannot be calculated accurately from the labels.
- Some of the salt in the “noodles and toppings” dissolves into the soup after hot water is added. Conversely, the noodles absorb soup
- The food composition table has a value for instant noodles “after cooking, with the soup left” (1.1 g per 100 g), but because the weight of the noodles in one serving is unknown, it could not be converted to a per-serving figure
- I could not find reliable data compiled by the government or others on the salt in a bowl of ramen or udon at a restaurant
Even so, it can be confirmed from the labels that the soup accounts for about half the salt in a serving.
The studies on “noodles and stomach cancer” include the broth
There are few studies that directly examined noodles and stomach cancer; the one found is a Korean case-control study (Kwak et al. 2021).
- Subjects: 307 pairs of people with and without stomach cancer
- Result: 1.65 times in the highest third of people eating noodle and dumpling dishes (including soupy dishes). This is after adjusting for H. pylori infection, energy, smoking, and alcohol. Among people who drink alcohol only, it was 2.00 times
- On the other hand, in the same study soups and jjigae (stews) showed no association
- The authors propose that Koreans “reduce the broth when eating noodles”
This study cannot tell which part of noodle and dumpling dishes (noodles, broth, or fillings) is involved. Whether “wheat noodles are the cause” or “the broth is the cause” has not been settled. What is clear is that the broth is high in salt.
Choosing reduced-salt foods
Practical ways to cut salt (measuring, leaving the broth, using sourness and herbs, etc.) are covered in our article on salt intake.
For stomach cancer, what Japan rates “probable” is salt and salt-preserved foods. If you want to cut daily salt from soups, mentsuyu, soy sauce, and the like, there are reduced-salt foods whose salt equivalent you can compare on the label. However, no study has been found that directly confirmed that using reduced-salt foods reduces stomach cancer.
Is charred grilled fish a cause of stomach cancer?
“Charred grilled fish causes stomach cancer” is a claim with weak evidence in humans.
When meat or fish is cooked at high temperature, substances called heterocyclic amines (HCAs) form. They cause genetic changes in bacterial tests and are known to cause cancer in animals. The IARC classifies PhIP, MeIQ, MeIQx, and others as “possibly carcinogenic to humans” (Group 2B) (1993).
In studies of people, however:
| Study or evaluation | Findings |
|---|---|
| WCRF/AICR (2016) | Grilled meat and fish: “limited-suggestive.” The basis is only 3 Japanese studies, split between one with 1.7 times the stomach cancer deaths for grilled fish and one with 0.84 times (no difference, 1,270 people). The study with 2.27 times for grilled meat had 57 deaths. A meta-analysis could not be done |
| Kono et al. 1988 (case-control study, Kitakyushu) | No relation between grilled fish (fresh, himono, salted fish) and stomach cancer |
| Kobayashi et al. 2009 (case-control study, Nagano, 149 stomach cancers) | No relation between dietary HCA intake and stomach cancer (adjusted for H. pylori infection, etc.) |
| National Cancer Center Japan | Grilled fish and charred parts are not an evaluation item |
According to a summary by researchers at the National Cancer Center Japan (Iwasaki and Tsugane 2021):
- Japanese people take in relatively little HCA from food, and on the mainland more than half comes from fish
- HCAs were found mostly in the fish skin
- Only 4 studies in Japan have examined HCAs and cancer, and none has found a relation with stomach cancer
| Grilled fish (per 100 g) | PhIP in skin | PhIP in flesh |
|---|---|---|
| Salted fish | 700 ng | 37 ng |
| Salmon | 593 ng | 29 ng |
| Himono (dried fish) | 368 ng | 52 ng |
| Horse mackerel, sardine | 147 ng | 8 ng |
| Pacific saury, mackerel | 160 ng | 28 ng |
| Eel | 11 ng | 15 ng |
Source: Table 1 of Iwasaki and Tsugane 2021 (originally an analysis by Kobayashi et al. 2002). Salted fish is hokke (Atka mackerel), and himono is dried split horse mackerel. PhIP is a type of HCA. 1 ng is one billionth of a gram.
It is true that HCAs collect in the charred skin, but it has not been shown that this amount increases stomach cancer in people.
For those who are concerned, there is an experiment in which briefly heating meat in a microwave before grilling greatly reduced the substances formed in charred meat (see our article on microwave ovens). Note that the 2011 “New 12 Recommendations for Preventing Cancer” has no item on charring. The claim that the old 12 recommendations said “avoid the burnt parts” could not be checked against the original text this time.
Do hot foods cause stomach cancer? That is about esophageal cancer
What is said to raise risk with “hot drinks and foods” is the esophagus, not the stomach.
- National Cancer Center Japan: hot food and drink are rated “probable” for increasing esophageal cancer. They are not evaluated for stomach cancer
- IARC: very hot drinks above 65°C are “probably carcinogenic” (Group 2A) for cancer of the esophagus (squamous cell carcinoma)
- World Cancer Research Fund: mate tea, drunk very hot in South America, is rated “probable” for increasing esophageal cancer. The cause is explained as heat damaging the lining of the esophagus, not a component of the tea
The National Cancer Center Japan recommends “letting hot drinks and foods cool before consuming them.” This recommendation is to protect the esophagus.
In Japanese studies of green tea and stomach cancer, women had less cancer in the lower part of the stomach, but no difference in the upper part (the side near the esophagus). One reason the National Cancer Center Japan mentions is the possibility that hot drinks affected the upper stomach and cancelled out the effect of green tea. This is not confirmed, however.
What foods protect against stomach cancer? Vegetables, fruit, and green tea
Vegetables and fruit are “possible”
Japan rates vegetables and fruit as “possible” for reducing stomach cancer.
- In a pooled analysis of 4 Japanese follow-up studies with about 190,000 people, 2,995 developed stomach cancer over an average of about 11 years. In men, those who ate the most vegetables overall had 0.78 times the risk of cancer on the outlet side of the stomach, and 0.81 times for green and yellow vegetables
- H. pylori infection was not examined in this analysis
- The World Cancer Research Fund rates “low fruit intake raises risk” as limited-suggestive, and has downgraded vegetables from the 2007 evaluation to “no conclusion”
Green tea is “possible” in women
For green tea, less stomach cancer has been found only in women.
- A summary of 6 Japanese follow-up studies with about 200,000 people (2009): women who drank 5 or more cups a day had 21% less than those who drank under 1 cup (30% less on the outlet side of the stomach). No relation in men
- This study adjusted for differences in rice, miso soup, tsukemono, smoking, alcohol, and so on, but did not examine H. pylori infection
- Japan’s rating was set at “probable” once in 2009 and then revised to “possible” in 2012. The World Cancer Research Fund says “no conclusion”
Vitamin C and spicy food
- Vitamin C: In a summary of 14 case-control studies worldwide (StoP, Sassano 2024), people in the top quarter for dietary vitamin C had 0.64 times, which shrank to 0.85 times after adjusting for vegetable and fruit intake. What was examined is vitamin C from food, not supplements. Japan’s rating for vitamins is “insufficient evidence”
- Spicy food: The World Cancer Research Fund has downgraded chili peppers from the 2007 evaluation to “no conclusion.” A study collecting meta-analyses found an association between spicy food and stomach cancer, but the authors say the health effect is unclear. For chili peppers, see our article on chili peppers and capsaicin
Is miso soup bad or good for stomach cancer?
For miso soup, studies give mixed results. It cannot be said either that it “prevents stomach cancer” or that it “causes stomach cancer.”
| Study | Findings |
|---|---|
| JACC study (Umesawa 2016) | 1.67 times for 3 bowls of miso soup a day, 1.64 times for 4 or more |
| Machida-Montani et al. 2004 (Nagano) | 2.1 times in people who eat a lot of miso soup (not significant) |
| Meta-analysis of Japanese and Korean studies (Kim et al. 2011) | 1.22 times for fermented soy foods (miso, natto, etc.) and 0.64 times for non-fermented soy foods (tofu, etc.) |
| JPHC study (Hara et al. 2012) | No relation between soy isoflavone intake and stomach cancer |
| National Cancer Center Japan’s rating | Soy is not evaluated for stomach cancer |
| World Cancer Research Fund | Soy products: “no conclusion” |
Rice miso (light-colored, salty type) has 12.4 g of salt equivalent per 100 g. The higher stomach cancer seen in some studies of miso soup may be a matter of the amount of salt rather than soy. For the claim that “miso soup prevents stomach cancer,” I could not confirm any underlying study in this survey.
What about meat, processed meat, and charred bread?
- Meat: In the JPHC study, neither meat overall nor any type of meat was related to stomach cancer overall. Women who ate a lot of chicken had less cancer on the outlet side of the stomach (0.75 times). Japan’s rating is “insufficient evidence”
- Processed meat (ham, sausage, etc.): The World Cancer Research Fund rates it limited-suggestive for the outlet side of the stomach, and the IARC gives “limited evidence” for the stomach (“sufficient evidence” for the colorectum). In studies of Japanese people, the difference is not clear
- Nitrite: The IARC gives “limited evidence” for stomach cancer for nitrate and nitrite under conditions that form nitroso compounds in the body. The World Cancer Research Fund says “no conclusion.” For the food additive sodium nitrite, see our article on color fixatives
- Charred bread (acrylamide): In the JPHC study, people in the top fifth for dietary acrylamide had 0.84 times (not significant), so there was no association. See our article on wheat flour and cancer for details
Alcohol, tobacco, and stomach cancer
Tobacco is rated “convincing” and alcohol “probable” (in men) for increasing stomach cancer.
- Smoking: In a meta-analysis of Japanese studies, smokers had 1.8 times (men), 1.2 times (women), and 1.6 times (overall) the risk of non-smokers
- Alcohol (men): In a summary of 6 Japanese follow-up studies with about 256,000 people (8,586 stomach cancers), 1.09 times for 23 to 46 g of ethanol a day, 1.18 times for 46 to 69 g, 1.21 times for 69 to 92 g, and 1.29 times for 92 g or more. No difference in women. This analysis could not adjust for H. pylori infection
- 23 g a day is about 1 go of sake (180 mL) or one 500 mL beer (National Cancer Center Japan)
- The World Cancer Research Fund says “probable at about 45 g or more a day,” and the IARC’s list by cancer site does not include alcohol and stomach cancer
For the types of alcohol and cancer, see our article on types of alcohol and cancer.
Do stress, heredity, coffee, and milk relate to stomach cancer?
Besides food, there are other commonly heard claims about causes of stomach cancer. We check them against the National Cancer Center Japan’s ratings and Japanese and Asian studies.
| Common claim | National rating | What is known |
|---|---|---|
| Does stress cause stomach cancer? | “Social and psychological factors”: insufficient evidence | Not enough studies to make a judgment |
| Is stomach cancer hereditary? | Family history is not on the list | In a summary of 12 Asian follow-up studies with about 550,000 people, 1.44 times if a family member has stomach cancer. However, family history is self-reported and H. pylori infection was not examined |
| Does being overweight cause stomach cancer? | Obesity: possible for the cardia | In 13 Asian follow-up studies with about 540,000 people, a “U-shape”: 15% higher when underweight (BMI under 18.5) and 12% higher when overweight (27.5 or more). In this analysis, the effect of high BMI was seen on the outlet side of the stomach, not the cardia. H. pylori was not taken into account |
| Does diabetes cause stomach cancer? | Insufficient evidence | 15% higher in 12 Asian follow-up studies with about 560,000 people. No information on H. pylori or salt |
| What about coffee? | Not evaluated for stomach cancer | In a Japanese study (JACC, adjusted for age only), men who drank more than 1 cup of coffee a day had 0.81 times, while women who drank 3 to 4 cups a day had 1.70 times, so the results do not agree. Japan has not made a rating |
| What about milk and dairy products? | Insufficient evidence | ― |
| What about exercise? | Not evaluated for stomach cancer | ― |
When a family member has stomach cancer, H. pylori may also have been passed on within the family. Because family history studies did not test for H. pylori, the effect of heredity and the effect of infection have not been separated. The National Cancer Center Japan recommends (not only for people with a family history) having regular stomach cancer screening, getting an H. pylori test when there is a chance, and deciding on eradication in close consultation with a doctor.
Why stomach cancer is common in Japan, and why it has declined
Seven in ten stomach cancers worldwide are in Asia
The IARC’s estimates (GLOBOCAN 2024) say that about 980,000 people worldwide are diagnosed with stomach cancer each year and about 640,000 die of it. Both are 5th among cancers.
- 70.8% of those diagnosed and 69.7% of those who die are in Asia
- By region, East Asia has the highest age-standardized incidence rate, and by country Mongolia had the highest value
- Reasons cited for East Asia’s high rate include high H. pylori infection rates, the type of H. pylori common in East Asia (a type of the toxin CagA; in a summary of Asian studies, the East Asian type [EPIYA-D] bacteria carried 1.91 times the stomach cancer risk of the EPIYA-C type common in Europe and America), and a diet high in salt-preserved foods. I could not find any source that separates how much each of these contributes
The death rate is under one-seventh of its 1960 level
Once the effect of age is smoothed out, stomach cancer in Japan has kept declining.
| Year | Age-adjusted death rate (per 100,000) | Deaths |
|---|---|---|
| 1960 | 73.1 | ― |
| 1975 | 56.9 | 49,857 |
| 1995 | 29.8 | 50,076 |
| 2015 | 14.8 | 46,681 |
| 2024 | 9.7 | 37,867 |
Source: National Cancer Center Japan, Cancer Information Service, “Cancer Statistics.”
- The age-adjusted death rate (a value that smooths out differences in age structure) fell about 87% from 1960 to 2024
- On the other hand, the number of deaths stayed flat for a long time because of population aging, and was highest in 1998 at 50,680. The 2024 figure of 37,867 is 4th among cancer deaths, after lung, colorectal, and pancreatic
- The number of people diagnosed is also falling. In the National Cancer Registry, it went from about 135,000 in 2016 to about 105,000 in 2023 (71,135 men and 33,729 women)
- The age-adjusted incidence rate (the share of people diagnosed) also fell by more than half, from 84.8 in 1985 to 38.7 in 2023 (per 100,000), in data from the 3 prefectures with long records
Overlaying wheat for the same period, wheat per person in Japan has been nearly constant at 31 to 33 kg since fiscal 1975. Over that time, the stomach cancer death rate fell to about one-sixth (56.9 in 1975 to 9.7 in 2024). This graph alone cannot establish a cause, but a movement of “stomach cancer rose because wheat rose” does not appear in the statistics.
H. pylori infection rates differ greatly by birth year
The main reason stomach cancer has declined is thought to be that the share of people infected with H. pylori is lower in younger generations.
- In an analysis pooling Japanese studies (Wang et al. 2017, 170,752 people), the rate fell from 67.4% for those born in 1930 to 34.9% for 1970, 15.6% for 1990, and 6.6% for 2000
- In another analysis (Ishibashi et al. 2025, 46,704 people), the share of people never infected rose from 21.1% for those born in 1930 to 91.7% for 1990 and 97.7% for 2010
- The National Cancer Center Japan summarizes it as “about 70 to 80% in generations born up to around the 1940s, and under 10% in generations born from 2000”
Wang et al. write that this generational difference in infection is considered the main reason deaths from stomach cancer in Japan have fallen. Based on these results, Ishibashi et al. touch on the possibility of reviewing how stomach cancer screening is done now.
Stomach cancer in young people and women
Across all ages, there are about 2.1 times as many male stomach cancer patients as female. But in people in their 20s and 30s, the numbers of men and women are about the same.
| Age | Diagnosed, men (2023) | Women | Deaths, men (2024) | Women |
|---|---|---|---|---|
| 20 to 29 | 44 | 51 | 17 | 12 |
| 30 to 39 | 264 | 261 | 61 | 71 |
| Total, 20 to 39 | 308 | 312 | 78 | 83 |
| 40 to 49 | 1,055 | 842 | 235 | 175 |
| All ages | 71,135 | 33,729 | 24,720 | 13,147 |
Source: Compiled by Urayomi from the National Cancer Center Japan, Cancer Information Service, “Cancer Statistics” (National Cancer Registry and vital statistics).
- Stomach cancer in ages 20 to 39 was 620 cases in 2023, about 0.6% of all stomach cancer. The numbers are small, but the distinctive feature is that there is no sex difference
- In an analysis summarizing studies of stomach cancer under age 50 (Li et al. 2024, 84 studies, 89,447 people), 53.7% were women and 71.1% were the “diffuse type,” in which the cancer spreads through the stomach wall; 60.0% were infected with H. pylori, and people with a family history of stomach cancer had 4.0 times the risk
- In a report on 4,608 stomach cancer patients treated at the National Cancer Center Central Hospital from 1971 to 1990, those under 40 were 7.1%, and the younger the patients, the smaller the sex ratio and the more diffuse-type cancer. It also reported that if found early, the course afterward did not differ from older patients
- For the claims that “stomach cancer in young women is often scirrhous stomach cancer (a type of diffuse cancer)” and that it is “increasing,” I found no nationwide statistics
National stomach cancer screening is for ages 50 and over. If a young person has ongoing stomach trouble, see a gastroenterologist without waiting for screening.
Bigger than diet: H. pylori eradication and stomach cancer screening
Most of the food differences so far were between 1.1 and 1.5 times. What has been confirmed to work the most against stomach cancer is H. pylori eradication and stomach cancer screening. No ads are placed in this section.
How much does eradication reduce stomach cancer?
| Study | Findings |
|---|---|
| Meta-analysis of randomized controlled trials (Ford et al. 2025) | In healthy infected people, eradication gave 0.64 times the stomach cancer (8 trials) and 0.78 times the stomach cancer deaths (5 trials). Recurrence in people who had early stomach cancer removed endoscopically was 0.52 times (3 trials) |
| Cochrane review (Ford et al. 2020) | 0.54 times for stomach cancer (7 trials, 8,323 people, 6 of them in Asia) and 0.61 times for stomach cancer deaths. All-cause deaths were 0.97 times, no difference. The authors limit the scope to “healthy infected people in Asia” |
| Meta-analysis of Japanese studies (National Cancer Center Japan, 19 studies) | 0.42 times stomach cancer with eradication (mostly observational studies). Japan’s rating is “convincing decrease in risk” |
The National Cancer Center Japan explains the following.
- A success rate of about 90% for eradication is expected
- Reflux esophagitis may occur after eradication
- Eradication does not bring the risk of stomach cancer to zero. After eradication, continue to have regular gastric endoscopies
- Whether to get tested for H. pylori and whether to undergo eradication is decided in close consultation with a doctor
Eradication for chronic gastritis with H. pylori infection has been covered by health insurance since February 2013 (before that, it covered gastric ulcers, duodenal ulcers, and the like).
Stomach cancer screening is for ages 50 and over, every 2 years
Under the national guidelines, stomach cancer screening is for ages 50 and over, every 2 years (MHLW “Guidelines for Health Education Focusing on Cancer Prevention and Implementation of Cancer Screening,” partially revised October 7, 2026).
| What is set | Details |
|---|---|
| Target | Ages 50 and over. For the stomach X-ray, ages 40 and over are acceptable for the time being |
| Ages especially recommended | 50 to 69 |
| Frequency | In principle every 2 years. For the stomach X-ray, once a year is acceptable for the time being |
| Test | In addition to an interview, either a stomach X-ray or a gastric endoscopy |
The guidelines state that for preventing stomach cancer, both “primary prevention such as improving diet, quitting smoking, and H. pylori eradication” and “screening (secondary prevention)” are important.
Screening is carried out by the municipality where you live. Check the municipality’s guide for how to get screened and the cost. For the national guide, see MHLW “Cancer screening”, and for prevention as a whole, see National Cancer Center Japan “Cancer Prevention for Japanese”.
Comparing the numbers
| Measure or factor | Size | Study type |
|---|---|---|
| Both H. pylori infection and atrophic gastritis | About 15× (outlet side of the stomach, compared with people with neither) | Value used in an estimate |
| H. pylori eradication | 0.64× (0.54×) | Meta-analysis of randomized controlled trials |
| Eating a lot of salted fish | 1.43× (men), 1.33× (women) | Follow-up study |
| Eating a lot of refined grains | 1.39× (1.13× in Asia alone, not significant) | Pooled analysis of case-control studies |
| Eating a lot of vegetables (men, outlet side of the stomach) | 0.78× | Follow-up study |
| Green tea, 5 or more cups a day (women) | 0.79× | Follow-up study |
Studies on food are mostly observational and cannot fully remove the effects of other lifestyle habits. What has been confirmed through to cause and effect is the randomized controlled trials of eradication.
What is known about food and stomach cancer prevention
Here are just the facts from studies and national recommendations.
- Salt-preserved foods (tarako, mentaiko, shiokara, tsukemono, salted fish) and salt: more stomach cancer in people who eat a lot (Japan’s rating is “probable”). The national target is under 7.5 g of salt for men and under 6.5 g for women
- Broth in noodle dishes and soups: the National Cancer Center Japan recommends “not to finish all of it.” About half the salt in instant noodles is in the soup
- Vegetables and fruit: tends to be lower in people who eat more (possible)
- Green tea: lower in women who drink 5 or more cups a day (possible). No difference in men
- Alcohol: higher in men with larger amounts (probable)
- Wheat, bread, noodles: no study shows that avoiding them reduces stomach cancer. More studies put whole grains on the lower side than refined grains (mostly case-control studies)
- Charred grilled fish, hot foods, miso soup: evidence in humans for stomach cancer is weak or mixed
And bigger than food, first of all, are H. pylori testing and eradication (in consultation with a doctor) and stomach cancer screening.
Items featured in this article (summary)
These are the items featured in the article, gathered again. The reasons and ingredients are in each section.
| Item featured | Where to buy |
|---|---|
| 無塩ドットコム (Muen.com; mail-order store specializing in low-salt and salt-free foods) | 他では買えない減塩食品がたくさん!減塩専門店「無塩ドットコム」  PR PR |
Summary
| Question | What we found |
|---|---|
| What causes stomach cancer? | The biggest is H. pylori (convincing). An estimated 90% of stomach cancers on the outlet side of the stomach are due to H. pylori. Smoking is also convincing |
| Which foods raise the risk of stomach cancer? | What Japan rates “probable” is salt and salt-preserved foods (tarako, mentaiko, shiokara, tsukemono, salted fish). The world’s evaluation: “salt-preserved foods probable, total salt no conclusion” |
| Do wheat, bread, and noodles cause stomach cancer? | It cannot be said. The grain named behind the national “grains = possible” rating is rice. The worldwide 1.39 times for refined grains is the total of rice, pasta, and white bread, and in Asia alone the difference is not clear |
| What about ramen and udon? | Wheat flour has 0 g of salt. 46 to 59% of the salt in one serving of instant noodles is in the soup. The national recommendation is “do not finish the broth in noodle dishes” |
| What about charred grilled fish? | Evidence in humans is weak (3 old Japanese studies whose results do not agree). Not a national evaluation item |
| What about hot drinks? | What is said to raise risk is esophageal cancer. Not evaluated for stomach cancer |
| What foods protect against stomach cancer? | Vegetables and fruit are “possible.” Green tea: 21% less in women at 5 or more cups a day. Miso soup: results are mixed |
| Why is it common in Japan, and why has it declined? | Seven in ten stomach cancers worldwide are in Asia. Japan’s death rate has fallen about 87% since 1960. The main reason is that H. pylori infection rates are lower in younger generations |
| What about young people and women? | In people in their 20s and 30s, the numbers of men and women are about the same. Young patients have more diffuse type. No nationwide statistics showing an “increase” were found |
| What is the most effective measure? | H. pylori eradication (0.64 times in randomized controlled trials) and stomach cancer screening for ages 50 and over every 2 years |
Sources
Evaluations and prevention
- National Cancer Center Japan, “Research on Cancer Risk Evaluation and Cancer Prevention Guideline Recommendations Based on Scientific Evidence,” evaluation list (version of May 26, 2026) and List of evaluated literature (grains × stomach cancer) https://epi.ncc.go.jp/can_prev/outcome/index.html
- National Cancer Center Japan, “Cancer Prevention for Japanese” https://epi.ncc.go.jp/can_prev/93/9830.html
- Same, evaluation pages: smoking and stomach cancer (785), green tea and stomach cancer (794, 2947), vegetables and fruit and stomach cancer (3492), H. pylori eradication and stomach cancer (8790), alcohol and stomach cancer (8904), family history (9480), diabetes (9481), body size (9177) https://epi.ncc.go.jp/can_prev/evaluation/
- World Cancer Research Fund / American Institute for Cancer Research. Diet, nutrition, physical activity and stomach cancer (Continuous Update Project, 2016, revised 2018) https://www.wcrf.org/resources/stomach-cancer-report
- IARC Monographs, “List of classifications by cancer sites with sufficient or limited evidence in humans” (Volumes 1–141)
- MHLW, “Guidelines for Health Education Focusing on Cancer Prevention and Implementation of Cancer Screening” (partially revised October 7, 2026), and “Cancer screening” https://www.mhlw.go.jp/stf/seisakunitsuite/bunya/0000059490.html
Statistics
- National Cancer Center Japan, Cancer Information Service, “Cancer Statistics” (cancer death data from vital statistics 1958 to 2024, National Cancer Registry 2016 to 2023, regional cancer registries of 3 prefectures) https://ganjoho.jp/reg_stat/statistics/data/dl/index.html
- MAFF, “Food Balance Sheet” (net food supply of wheat per person per year)
- International Agency for Research on Cancer. GLOBOCAN 2024, Stomach fact sheet
- Wang C, et al. Sci Rep 2017;7:15491 (PMID 29138514) / Ishibashi F, et al. Helicobacter 2025 (PMID 40500921)
- Lin Y, et al. GHM Open 2021;1(2):63-69 (PMID 40145072)
- Li Q, et al. Medicine 2017 (PMID 28445260)
Wheat and grains
- Kato I, et al. Jpn J Cancer Res 1992 (PMID 1483928) / Tajima K, Tominaga S. Jpn J Cancer Res 1985 (PMID 3930448) / Kono S, et al. Jpn J Cancer Res 1988 (PMID 3143695) / Ito LS, et al. Ann Epidemiol 2003 (PMID 12547482) / Machida-Montani A, et al. Gastric Cancer 2004 (PMID 15052440)
- Turati F, et al. Consumption of whole and refined grains and the risk of gastric cancer: a pooled analysis within the StoP Project. Eur J Nutr 2026 (PMID 42287468)
- Wang T, et al. Int J Food Sci Nutr 2020 (PMID 31314629) / Xu Y, et al. Food Sci Nutr 2019 (PMID 30680179) / Zhang XF, et al. Nutr J 2020 (PMID 32493399) / Gaesser GA. Nutrients 2020 (PMID 33297391) / Kim S, et al. J Gastric Cancer 2025 (PMID 40200873)
- Tokui N, et al. J Epidemiol 2005 (JACC study, PMID 16127240) / Cai H, et al. Cancer Sci 2022 (PMID 34821435) / Katagiri R, et al. Int J Cancer 2021 (PMID 33348433) / Hara N, et al. Nutr Cancer 1984 (PMID 6545578) / Ji BT, et al. Int J Cancer 1998 (PMID 9610722)
Salt and noodles
- MEXT, Standard Tables of Food Composition in Japan (8th revised edition), 2023 Supplement https://www.mext.go.jp/a_menu/syokuhinseibun/mext_00001.html
- Nissin Foods official product pages (Cup Noodle, Cup Noodle PRO High Protein & Low Carb, Even Less Salt, Nissin Donbei Kitsune Udon east and west), confirmed October 8, 2026
- MHLW, “Dietary Reference Intakes for Japanese (2025 edition)”
- Hirabayashi M, et al. Eur J Nutr 2024 (PMID 38703225) / Umesawa M, et al. J Epidemiol 2016 (PMID 26477994) / Takachi R, et al. Am J Clin Nutr 2010 (PMID 20016010) / Yoo JY, et al. Cancers 2020 (PMID 32316595)
- Kwak JH, et al. Nutrients 2021;13:1365 (PMID 33921757)
Other foods
- Iwasaki M, Tsugane S. Genes Environ 2021 (PMID 34315542) / Kobayashi M, et al. Mutat Res 2002;506-507:233-241 / Kobayashi M, et al. Gastric Cancer 2009;12:198-205
- Kim J, et al. Cancer Sci 2011 (PMID 21070479) / Hara A, et al. Am J Clin Nutr 2012 (PMID 22170362)
- Wilunda C, et al. Am J Clin Nutr 2022 (PMID 34788357) / Liu R, et al. Cancer Epidemiol Biomarkers Prev 2019 (PMID 31186264)
- Sassano M, et al. Gastric Cancer 2024 (PMID 38436761) / Ao Z, et al. Mol Nutr Food Res 2022 (PMID 36111960)
Young people and eradication
- Li Y, et al. Clin Transl Gastroenterol 2024 (PMID 38717039) / Katai H, et al. 1996 (PMID 8656553)
- Ford AC, et al. Gastroenterology 2025;169:261-276 (PMID 39824392) / Ford AC, et al. Cochrane Database Syst Rev 2020 (PMID 32628791)
- Insurance coverage of eradication for chronic gastritis (February 2013): news article from CareNet https://www.carenet.com/news/general/carenet/33974 / document in the Japanese Red Cross Society institutional repository https://redcross.repo.nii.ac.jp/record/11708/files/pdf007787.pdf
Related articles and databases
- Does Eating Too Much Wheat Flour Cause Colorectal Cancer? Checking the Link Between Wheat and Cancer Against Studies and Government Data
- Where Does “Too Much Salt” Begin? Checking Japan’s Salt Intake Trend, Target Amounts, and the Links to High Blood Pressure and Stomach Cancer Against National Surveys and Studies
- Diseases Caused by Wheat: How Wheat Allergy, Celiac Disease, and Gluten Sensitivity Differ, and Why They Can Suddenly Start in Adulthood
- Is wheat bad for you? Checking the effects of going “wheat-free” and “gluten-free” against the research. What happens if you quit?