
Where Does “Too Much Salt” Begin? Checking Japan’s Salt Intake Trend, Target Amounts, and the Links to High Blood Pressure and Stomach Cancer Against National Surveys and Studies

PR This article contains affiliate links to Rakuten Ichiba and A8.net (“See on Rakuten”, etc.). What is written here is based on documents from public agencies and on studies, regardless of whether there are ads. The “See on Amazon.co.jp” and “See on Yahoo! Shopping” links are also affiliate links.
You often hear “watch out for too much salt,” but it is surprisingly unclear from how many grams it counts as “too much.” Some places say the target is 7.5 g, others 6 g, others 5 g. On the back of a food package, you see “salt equivalent” (食塩相当量) rather than “sodium,” and you may also hear that you need not worry if the salt is natural salt or sea salt.
In this article, we check the following against national surveys, the food composition tables, and studies:
- Where is the line for “too much”? How do the targets of Japan, the WHO, the United States, and the United Kingdom differ?
- How much salt do Japanese people actually eat, and how has that changed over the past 20-plus years?
- Compared with other countries, is Japanese salt intake high? Where does the salt come from?
- For salt and high blood pressure, stroke, and stomach cancer, what kinds of studies exist and how far do they go?
- What is the “salt equivalent” on a label? How does it differ from sodium (the reason for 2.54 times)?
- The salt equivalent of each seasoning: soy sauce, miso, nam pla, salt-based sauces, and so on
- What do the national and local governments recommend for cutting salt?
Conclusions
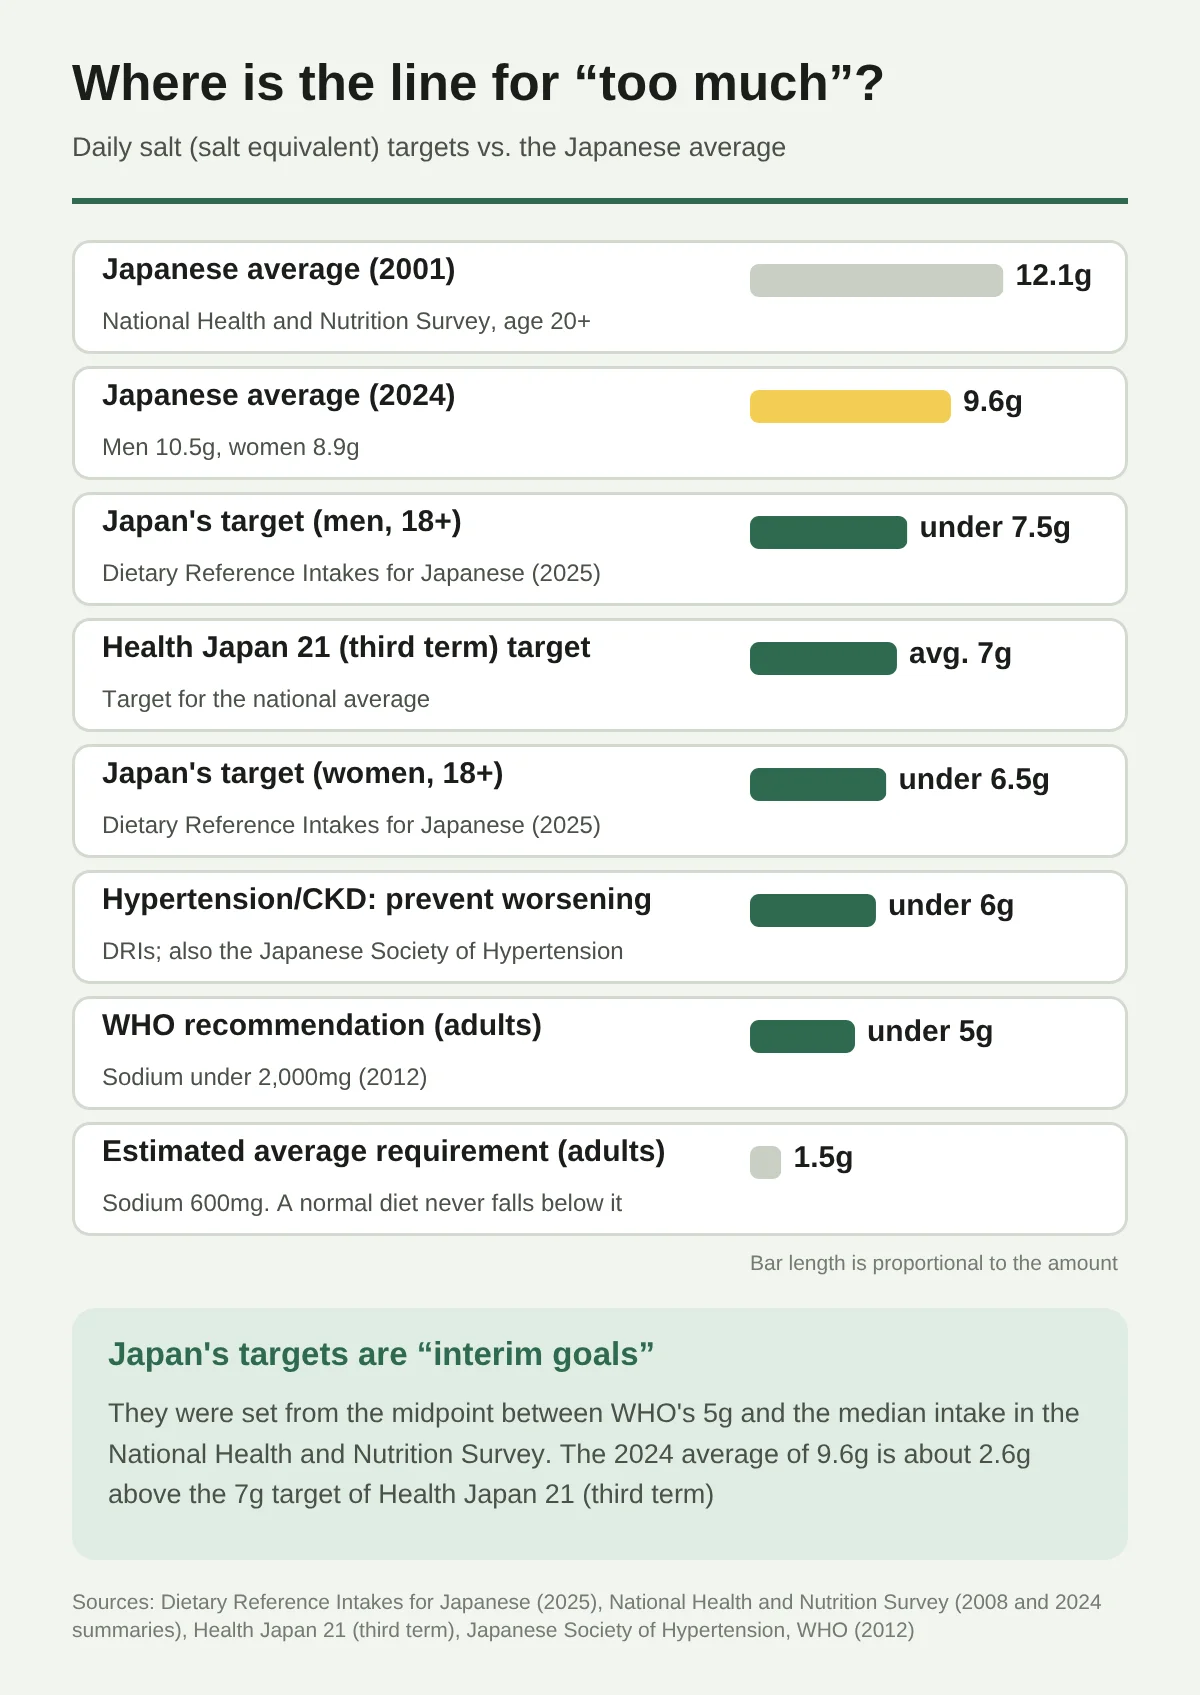
- Japan’s target for those 18 and older is under 7.5 g for men and under 6.5 g for women (Dietary Reference Intakes for Japanese, 2025 edition). For preventing the worsening of high blood pressure and chronic kidney disease, it is under 6 g. The WHO recommends under 5 g, but Japan’s target is an interim goal set at “the midpoint between the WHO’s 5 g and the current intake of Japanese people.”
- The average salt intake of Japanese people (aged 20 and over) fell from 12.1 g in 2001 to 9.6 g in 2024. That is still about 2.6 g above the national target (an average of 7 g), and over the 10 years from 2013 to 2023 there was no statistically meaningful increase or decrease for either men or women (National Health and Nutrition Survey).
- In overseas estimates (WHO, 2019), Japan is at 10.2 g, lower than China (17.7 g) and South Korea (12.3 g) but higher than the United States (8.9 g) and the United Kingdom (7.1 g). In Japan, about 20% of salt came from soy sauce (INTERMAP study).
- That cutting salt lowers blood pressure has been confirmed by meta-analyses of randomized controlled trials (cutting about 4.4 g on average lowered the upper (systolic) blood pressure by about 4.2 mmHg). The link with stroke rests mainly on observational studies, and one report found that 5 g more salt a day meant a 23% higher risk of stroke.
- For stomach cancer, the National Cancer Center Japan evaluates that salt and salted foods raise the risk of stomach cancer at the “probable” level. The biggest cause of stomach cancer is Helicobacter pylori (H. pylori; rated “convincing”), and salt is evaluated as a separate factor from it.
- The salt equivalent on a label is “sodium × 2.54”, whatever the type of salt. Even with natural salt or sea salt, the amount of sodium entering your body is determined by the salt equivalent on the label.
Products featured in this article
Within the article, we introduce the following in line with each point (they are Rakuten Ichiba and A8.net links).
| For people who | What we introduce | Why we chose it (facts) | Where |
|---|---|---|---|
| Like the taste of salt-based sauce but want to know its salt equivalent | Yakiniku Za Punch Shiodare no Moto (salt-sauce base) (Nitonya) | Ingredients are only sun-dried salt, garlic, pepper, and chili pepper. The label states a salt equivalent of 71.1 g per 100 g | Salt, salt sauces, and granulated dashi are a different order of magnitude |
| Want to check the strength of miso soup or soup as a number | Tanita electronic salt meter Shiomikun SO-313 | A meter that shows the salt concentration of soups in 6 steps from 0.4 to 1.4% | Salt-cutting tips recommended by the national and local governments |
| Want to use a reduced-salt soy sauce with simple ingredients | Choko Shoyu Chotokusen Genen Shoyu (reduced-salt soy sauce) | Ingredients are only soybeans, wheat, and salt. The label states a salt equivalent of 8.4 g per 100 ml | When choosing reduced-salt seasonings, compare by the label |
| Want to look for reduced-salt and no-salt foods all in one place | Muen.com (mail-order for reduced-salt foods) | A specialty mail-order shop handling reduced-salt and no-salt foods and seasonings | When choosing reduced-salt seasonings, compare by the label |
Where is the line for “too much”?
Targets of Japan, the WHO, the United States, and the United Kingdom
Salt targets differ by who issues them and for what purpose.
| Issued by | Amount per day (salt equivalent) | Position |
|---|---|---|
| WHO (2012 guideline) | Under 5 g (sodium under 2,000 mg) | A “strong recommendation” for adults. For children, lowered according to energy needs |
| Dietary Reference Intakes for Japanese (2025 edition) | Under 7.5 g for men, under 6.5 g for women | The “target amount” for those 18 and older. For preventing lifestyle-related diseases |
| Same (preventing worsening) | Under 6 g | For preventing the worsening of high blood pressure and chronic kidney disease (CKD) (both sexes) |
| Health Japan 21 (Third Term) | Average 7 g | A target for the national average |
| Japanese Society of Hypertension | Under 6 g | Salt-reduction target for treating and preventing high blood pressure |
| United States (Dietary Guidelines) | Sodium under 2,300 mg (about 5.8 g as salt) | Adults. Lower for those under 14 |
| United Kingdom (Food Standards Agency) | Adult average of 6 g | A value set as the national target through 2012 |
None of these is a line where going 1 g over means danger. The WHO’s 5 g is a recommendation for lowering the risk of high blood pressure, heart disease, and stroke. As we see below, Japan’s 7.5 g and 6.5 g are interim targets set with “what can be done in practice” in mind.
Japan’s target is “the midpoint between 5 g and the current amount”
For sodium, the Dietary Reference Intakes for Japanese (2025 edition) set the following:
- The estimated average requirement (a guide to the amount the body needs) for adults is 600 mg of sodium (1.5 g salt equivalent). The report says that on an ordinary diet, the salt intake of Japanese people never falls below 1.5 g.
- For the target amount, because very few people could reach the WHO’s recommended 5 g with today’s eating habits, it is based on a value midway between “5 g” and “the median intake in the National Health and Nutrition Survey.”
For example, for men aged 18–29, the midpoint between 5.00 g and the median intake of 10.07 g is 7.54 g. Rounded to a clean value, that is “under 7.5 g.” The same calculation for women gives 6.73 g, which becomes “under 6.5 g.”
In other words, Japan’s target amount is “not an ideal value for health, but a value for taking one step closer from today’s eating habits.” The WHO’s 5 g is the one presented as closer to the ideal.
How much do Japanese people eat?
From 12.1 g in 2001 to 9.6 g in 2024
Every year, the Ministry of Health, Labour and Welfare (MHLW) surveys the daily salt intake of people aged 20 and over in the National Health and Nutrition Survey. (In practice, it is a value calculated from the sodium in the food composition tables, based on records of what people ate.)
- It fell from 12.1 g in 2001 (men 12.9 g, women 11.5 g) to 9.6 g in 2024 (men 10.5 g, women 8.9 g). The 9.6 g in 2024 is the lowest value in these 12 years.
- Still, it is about 2.6 g above the Health Japan 21 (Third Term) target of 7 g.
- Looking at the 10 years from 2013 to 2023, there was no statistically meaningful increase or decrease for either men or women (2023 survey results). It fell year by year in the 2000s, but since the latter half of the 2010s it has been roughly flat.
- In 2020 and 2021, the survey was canceled because of the new coronavirus.
Highest in the 60s by age, and tends to be higher in eastern Japan
In the 2024 survey, the highest by age group for both men and women was the 60s (men 11.1 g, women 9.3 g). The lowest were men in their 20s (9.9 g) and women in their 20s and 30s (8.3 g).
By prefecture (age-adjusted values), men were high in Yamanashi and Akita at 11.7 g, and women were high in Miyagi, Nagano, and Akita at 9.8 g. When the prefectures were divided into four groups, among men there was a gap of about 1.7 g between the top group (average 11.4 g) and the bottom group (9.6 g).
How to read the numbers The salt in the National Health and Nutrition Survey is a value calculated from a record of one day’s meals (any one day, excluding Sundays and holidays). Because it is a one-day record, it differs from each person’s “usual amount.” These numbers are for looking at the national average and year-to-year changes.
Is Japan high compared with other countries?
Estimates by country
In its 2023 report, the WHO lines up estimated salt (sodium) intakes for adults in each country. They are not national surveys collected as they are, but model estimates that the Institute for Health Metrics and Evaluation (IHME) in the United States calculated for the Global Burden of Disease Study (2019).
- The world average is 4,310 mg of sodium (10.78 g of salt in the WHO text), more than twice the WHO recommendation. Estimates by country range from 2,006 mg to 6,950 mg of sodium.
- Japan is at 10.2 g (4,027 mg of sodium). It is lower than China (17.7 g) and South Korea (12.3 g), and higher than the United States (8.9 g), France (7.6 g), and the United Kingdom (7.1 g).
- The WHO estimates that deaths related to excess sodium come to about 1.89 million a year worldwide.
The 2019 value in Japan’s National Health and Nutrition Survey was 10.1 g. It is calculated differently from the WHO table’s 10.2 g, so you need not worry about the small difference.
Japanese salt comes from “soy sauce, fish, soups, and pickles”
Where salt comes from differs greatly by country. In INTERMAP, an international joint study that surveyed people aged 40–59 in Japan, China, the United Kingdom, and the United States in 1996–1999, the results were as follows.
| Country | Main sources of salt |
|---|---|
| Japan | Soy sauce (about 20%), processed seafood (salted fish, fish roe, and so on; about 15%), soups (about 15%, of which miso soup was 9.7%), and pickles (about 13%). These four make up about 63% |
| China (rural areas) | About 76% was salt added when cooking at home |
| United Kingdom, United States | Processed foods such as bread and grain products were the bulk (95% in the UK, 71% in the US; the US figure comes out lower because of how it was surveyed) |
In this study, sodium measured in the 24-hour urine of Japanese men was 4.49–5.06 g a day (as sodium), a level higher than in the United States (4.14–4.37 g) and the United Kingdom (3.70 g) (northern China was higher still).
In Japan, this means that “salt already in soy sauce, miso, and processed foods” is bigger than “salt you sprinkle when cooking.” This is why salt-cutting efforts turn to “the amount of seasonings” and “reading the label.”
Salt and high blood pressure or stroke: what research shows
There are several kinds of studies that look at the relationship between salt and disease.
- Randomized controlled trials: People are divided by lottery into a group that “cuts salt” and one that does not, and compared. Well suited to confirming cause and effect.
- Cohort studies (observational studies): Many people’s eating habits are surveyed and followed for years, and those who get a disease are counted. The effects of other lifestyle habits can get mixed in.
- Meta-analyses: Studies on the same theme are gathered and their results recalculated together.
Cutting salt lowers blood pressure: summaries of randomized controlled trials
| Study | Type | Main results |
|---|---|---|
| He et al. 2013 (BMJ, Cochrane) | Meta-analysis of 34 trials lasting 4 weeks or more, 3,230 people | Cutting salt by about 4.4 g on average lowered the upper blood pressure by 4.18 mmHg and the lower by 2.06 mmHg. In people with high blood pressure the upper fell 5.39 mmHg, and even in people with normal blood pressure it fell 2.42 mmHg |
| Huang et al. 2020 (BMJ) | Meta-analysis of 133 trials, 12,197 people | For every 50 mmol (about 2.9 g of salt) drop in urinary sodium, the upper blood pressure fell 1.10 mmHg. In trials lasting 15 days or more, the drop was about twice that of shorter trials |
| Filippini et al. 2021 (Circulation) | Meta-analysis of 85 trials (dose-response) | Blood pressure fell in proportion to the amount of sodium cut, with a larger effect in people with high blood pressure |
“Cutting salt lowers blood pressure” is something confirmed in trials on people. How much it falls varies by individual, and people whose blood pressure is higher to begin with tend to see a bigger drop.
Stroke and heart disease: mainly observational studies
For stroke and heart disease, which lie beyond blood pressure, you have to follow people for years, so observational studies are the mainstay.
| Study | Type | Main results |
|---|---|---|
| Strazzullo et al. 2009 (BMJ) | Meta-analysis of 13 cohort studies, 177,025 people | With 5 g more salt a day, the risk of stroke was 23% higher. Cardiovascular disease overall was 14% higher (barely not statistically meaningful) |
| Aburto et al. 2013 (BMJ, commissioned by the WHO) | Meta-analysis of 37 trials and 14 cohort studies | People with more sodium had a 24% higher risk of stroke. There was no meaningful relationship with all-cause death |
| Takachi et al. 2010 (Japan, JPHC Study) | Cohort study of about 77,500 people aged 45–74 | The group with the most sodium had a 19% higher risk of cardiovascular disease than the group with the least. There was no relationship with cancer overall |
| Ma et al. 2022 (NEJM) | Six cohorts in the US and Europe, 10,709 people (24-hour urine collected multiple times and measured) | For every 1,000 mg more urinary sodium a day, the risk of cardiovascular disease was 18% higher. The relationship was proportional to the amount, and no pattern of rising risk at the low end was seen |
Some studies say “cutting too much is also not good”
On the other hand, in the PURE study (O’Donnell et al. 2014, NEJM), which examined about 100,000 people in 17 countries, risk was high not only in people with 7 g or more of sodium a day (about 18 g or more of salt) but also in people with under 3 g (under about 7.6 g of salt), a “J-shaped” result.
However, this study estimated the daily amount from a single morning urine sample (spot urine). In Ma et al. 2022, which collected 24-hour urine multiple times, no pattern of rising risk at the low end was seen. Results split depending on how it is measured, and the debate continues. Either way, the Japanese average (9.6 g) does not fall on the “too little” side in either study.
Swapping salt for potassium trials
In a randomized controlled trial in 600 villages in rural China with 20,995 people (those who had had a stroke, or people 60 or older with high blood pressure) (SSaSS, Neal et al. 2021, NEJM), participants used for about 4.7 years a reduced-sodium salt of “75% sodium chloride + 25% potassium chloride” in place of ordinary salt.
- Stroke was 14% lower, major cardiovascular events were 13% lower, and death was 12% lower.
- Hyperkalemia (too much potassium in the blood), which had been a concern, had not increased.
However, as explanations from medical institutions in Japan and elsewhere caution, salt containing a lot of potassium may cause hyperkalemia in people whose kidney function has declined or who take drugs that make the body hold on to potassium (such as potassium-sparing diuretics) (the WHO fact sheet suggests switching to a potassium-containing reduced-sodium salt substitute if you use table salt, but does not give this individual caution). Consult a doctor before using it.
Salt and stomach cancer
The National Cancer Center Japan’s evaluation is “probable”
Based on studies of Japanese people, the National Cancer Center Japan evaluates the strength of evidence for each cause of cancer on four levels (convincing, probable, possible, insufficient data).
| Factor | Effect on stomach cancer |
|---|---|
| Helicobacter pylori (H. pylori) infection | Convincingly raises the risk |
| Eradication of H. pylori | Convincingly lowers the risk |
| Salt and salted foods | Probably raise the risk |
| Vegetables and fruit | “Possibly” lower the risk of stomach cancer |
The National Cancer Center Japan estimates that, of cancers in Japanese people, 3.0% in men and 1.6% in women could be prevented by cutting salt.
What research shows
| Study | Type | Main results |
|---|---|---|
| Tsugane et al. 2004 (Japan, JPHC Study) | Cohort study following about 39,000 people aged 40–59 for 11 years | In men, the more salt, the more stomach cancer (unclear for women). Salted fish roe such as tarako and ikura, and salted delicacies such as shiokara (salted fish guts) were linked to higher risk in both sexes |
| Shikata et al. 2006 (Japan, Hisayama Study) | Cohort study following 2,476 people aged 40 and over for 14 years | Compared with people with under 10 g of salt a day, those with 16 g or more had about three times the risk of stomach cancer (hazard ratio 2.98). The relationship was clear in people infected with H. pylori who also had atrophic gastritis |
| Ge et al. 2012 | Meta-analysis of 11 observational studies | People with high salt intake had about twice the risk of stomach cancer (odds ratio 2.05). Limited to Japanese studies, 2.61 |
| Morais et al. 2022 (StoP Project) | Pooled analysis of 25 case-control studies, about 35,000 people | Risk was higher in people who like salty taste (1.59 times) and people who always use table salt (1.33 times). On the other hand, there was no statistically meaningful difference in the calculated total amount of sodium |
Internationally as well, a joint expert consultation of the WHO and the FAO (Food and Agriculture Organization of the United Nations) (2003) concluded that “salted foods and salt probably raise the risk of stomach cancer.”
On the mechanism. Experiments in animals and cells have reported that concentrated salt damages the stomach lining and causes inflammation, makes it easier for H. pylori to settle in, and strengthens the activity of the gene (cagA) for the H. pylori toxin. In human studies as well, results show the relationship becoming clear when salt and H. pylori overlap (Hisayama Study).
It is not “just worry about salt” For stomach cancer, H. pylori infection is a “convincing” cause, and it is also “convincing” that eradication lowers the risk. The National Cancer Center Japan also recommends getting tested for H. pylori once and getting regular stomach cancer screening.
Sodium and salt equivalent: how to read the label
Salt equivalent is “sodium × 2.54”
In the nutrition facts on the back of a food package, you see “salt equivalent” (食塩相当量) rather than “sodium.” Under the Food Labeling Standards, the value of sodium multiplied by 2.54 is called “salt equivalent,” and this is what is to be shown.
2.54 is the ratio of the weight of salt (sodium chloride) to the weight of sodium. Dividing the molecular weight of salt (about 58.5) by the atomic weight of sodium (about 23) gives 2.54.
| Sodium | Salt equivalent |
|---|---|
| 400 mg | About 1.0 g |
| 1,000 mg | 2.54 g |
| 2,000 mg (the WHO’s recommended upper limit) | About 5.1 g |
| 2,300 mg (the US upper limit) | About 5.8 g |
Overseas products, English-language papers, and WHO materials are often written in sodium (mg), so when comparing, multiply by 2.54 to convert to salt.
Salt equivalent also includes sodium other than salt Salt equivalent is a value calculated from the amount of sodium contained in the food. So it adds up not only salt (sodium chloride) but also sodium in other forms, such as monosodium glutamate (our article on umami seasonings) and baking soda (sodium bicarbonate).
From “sodium” to “salt equivalent”
When the Food Labeling Act took effect in April 2015, it became mandatory for processed foods in containers and packages to show five items: energy, protein, fat, carbohydrate, and sodium (shown as salt equivalent). The transition period until then ran through March 31, 2020 for processed foods.
When the Food Labeling Standards were drawn up, the Consumer Commission’s materials summarized it as “replace the sodium label with ‘salt equivalent,’ which is more familiar to consumers.” Even now, the “sodium” number may be written only for foods to which no sodium salt has been added, and only alongside the salt equivalent.
Conditions for writing “reduced salt” or “low salt”
There are rules for claims such as “reduced salt” (減塩), “XX% less salt,” and “no added salt” (Food Labeling Standards, summarized in the Tokyo Metropolitan Government’s guidebook).
| Type of claim | Example | Condition (per 100 g) |
|---|---|---|
| Free of | “No salt” (無塩), “zero salt” | Sodium under 5 mg |
| Low | “Low salt” (低塩), “light on salt” (塩分ひかえめ) | Sodium 120 mg or less (about 0.3 g or less as salt equivalent) |
| Reduced | “Reduced salt” (減塩), “XX% less salt” (塩分○%カット) | At least 120 mg less sodium than the comparison food, and at least 25% less. There is an exception allowing 15% or more for miso and 20% or more for soy sauce |
| Not added | “No added salt” (食塩無添加) | No sodium salt added, and no ingredient that substitutes for salt (such as soy sauce) used, among other conditions |
Soy sauce has a separate rule too: “reduced salt” can be written only if the salt content is 9 g or less per 100 g.
“Reduced salt” means “less than the ordinary product,” not “little.” Even reduced-salt soy sauce has a salt equivalent of around 8 g per 100 g. When comparing amounts, the salt equivalent in the nutrition facts is more reliable than the words “reduced salt” in the table.
Salt equivalent of each seasoning
Soy sauce, miso, nam pla, and sauces
Using the MEXT food composition tables, we compared the salt equivalent per 100 g of commonly used seasonings.
- Nam pla (22.9 g) is about 1.6 times koikuchi (dark) soy sauce (14.5 g). Japanese fish sauces such as ishiru (21.9 g) and shottsuru (24.3 g) are about the same.
- Usukuchi (light) soy sauce (16.0 g) has more than koikuchi (dark) soy sauce (14.5 g). “Usukuchi” means light in color; it does not mean light in salt.
- Reduced-salt soy sauce (8.3 g) is about 57% of koikuchi soy sauce. Reduced-salt miso (10.7 g) is about 86% of light-colored dry miso (12.4 g).
- Ketchup (3.1 g) and mayonnaise (1.9 g) are on the low side per 100 g. However, the more you use, the more it adds up.
By the amount that gives 1 g of salt, it is about 6.9 g for koikuchi soy sauce, about 4.4 g for nam pla, and about 8.1 g for light-colored dry miso (calculated as 100 ÷ salt equivalent).
Salt, salt sauces, and granulated dashi are a different order of magnitude
Powdered and granulated seasonings are an order of magnitude different from liquid ones.
| Name | Salt equivalent per 100 g | Amount that gives 1 g of salt | Source |
|---|---|---|---|
| Refined salt (for home use) | 99.6 g | About 1.0 g | Food composition tables |
| Table salt | 99.5 g | About 1.0 g | Food composition tables |
| Namishio (ordinary salt) | 97.3 g | About 1.0 g | Food composition tables |
| Sel Marin de Guérande, Guérande salt (granulated) | 93.9 g (estimate) | About 1.1 g | Product label |
| Okinawa seawater salt Aoi Umi | 91.1 g (estimate) | About 1.1 g | Product label |
| Yukishio (powder type) | 72.6 g | About 1.4 g | Product label (value from the official online shop) |
| Yakiniku Za Punch Shiodare no Moto | 71.1 g | About 1.4 g | Product label |
| Granulated Chinese-style dashi | 47.5 g | About 2.1 g | Food composition tables |
| Reduced-sodium table salt (no seasoning added) | 45.7 g (potassium 25,000 mg) | About 2.2 g | Food composition tables |
| Bouillon cubes | 43.2 g | About 2.3 g | Food composition tables |
| Granulated Japanese-style dashi | 40.6 g | About 2.5 g | Food composition tables |
By type of salt, even salt made only from seawater has a salt equivalent of 70 to 90-odd g per 100 g. Yukishio has a salt equivalent about 70% that of refined salt, and its label also gives amounts such as magnesium (3,310 mg per 100 g).
However, the amount of sodium that enters your body is determined by “how many grams you used × salt equivalent,” not by “which salt.” We found no basis in the public documents we checked for saying “it’s natural salt or sea salt, so it’s fine to use a lot.” When in doubt, it is most reliable to compare by the salt equivalent on the label (how to read the ingredient and process labels for salt is explained on the “salt and seawater” page of our ingredient dictionary).
Yakiniku Za Punch, a salt-sauce base, is mostly salt. One gram gives a salt equivalent of about 0.7 g. It is made completely differently from liquid yakiniku sauce (8.3 g per 100 g as a food-table estimate). The amount you use determines the salt equivalent, so measuring how much you sprinkle makes the calculation easier.
Salt-cutting tips recommended by the national and local governments
Materials from the Ministry of Agriculture, Forestry and Fisheries (MAFF) and local governments list tips such as the following.
| Tip | Details | Source |
|---|---|---|
| Measure | Measure with measuring spoons and so on rather than by eye | Funabashi City |
| Leave the broth | Leave as much of the soup as you can from noodles such as ramen and udon | Saitama City |
| Taste before adding | Use tabletop seasonings sparingly, after tasting | Saitama City |
| Accents of flavor | Use sourness such as vinegar, spices, and condiments | Funabashi City |
| Read the label | Choose foods and restaurant meals by the salt equivalent in the nutrition facts | Saitama City |
| Eat until about 80% full | Eating too much also increases the amount of salt | Funabashi City |
| Eat vegetables and fruit | The sodium in salt leaves the body together with potassium. Potassium is abundant in vegetables, seaweed, potatoes, fruit, milk, and so on | MAFF |
For Japanese people, much of the salt comes from soy sauce, miso, and processed foods (INTERMAP study), so knowing “what has how much in it” is the shortest way. For soups, measuring the strength with a salt meter turns your usual taste into a number.
When choosing reduced-salt seasonings, compare by the label
Reduced-salt soy sauce and reduced-salt miso are one way to cut salt without changing your usual cooking. However, the degree of “reduced salt” differs by product, so it is most reliable to compare by the salt equivalent in the nutrition facts. The ingredients also range from those with only “soybeans, wheat, and salt,” the same as ordinary soy sauce, to those with dashi and seasonings added.
For a one-stop search for reduced-salt foods and no-salt seasonings, there is also a specialty mail-order shop.
If you choose a reduced-sodium salt that uses potassium (salt containing potassium chloride), as written earlier, people with kidney disease or those whose potassium is restricted should consult a doctor first.
Summary
| Point | What is known | Strength of evidence and source |
|---|---|---|
| Target amount | Japan: under 7.5 g for men, under 6.5 g for women (under 6 g for preventing worsening of high blood pressure and CKD). WHO: under 5 g. Japan’s value is “the midpoint between 5 g and the current amount” | Dietary Reference Intakes for Japanese 2025 edition, WHO 2012 |
| Japanese intake | 12.1 g in 2001 to 9.6 g in 2024. About 2.6 g above the 7 g target, and flat in 2013–2023 | National Health and Nutrition Survey |
| Comparison with other countries | Japan 10.2 g (estimate). Lower than China and South Korea, higher than the US and UK | WHO 2023 (IHME estimates) |
| Where Japanese salt comes from | Soy sauce about 20%; processed seafood, soups, and pickles together make about 63% | INTERMAP study |
| High blood pressure | Cutting salt lowers blood pressure | Meta-analyses of randomized controlled trials |
| Stroke and heart disease | The more salt, the higher the risk, as a tendency. Studies split on whether risk rises at the low end | Meta-analyses of observational studies, randomized controlled trial of salt substitute |
| Stomach cancer | Salt and salted foods “probably” raise the risk. H. pylori is “convincing” | National Cancer Center Japan, observational studies in Japan and overseas |
| Labels | Salt equivalent = sodium × 2.54. Regardless of type of salt. “Reduced salt” means less than the comparison product | Food Labeling Standards |
Items introduced in this article:
The mail-order shop for reduced-salt and no-salt foods (Muen.com) is introduced in When choosing reduced-salt seasonings, compare by the label.
There is no single answer to “from how many grams does it count as too much?” But what is clear from the national survey is that the Japanese average of 9.6 g is higher than both Japan’s target and the WHO’s recommendation. A good place to start is to check, once, the salt equivalent on the labels of the soy sauce, miso, and sauces you usually use.
Sources
- Ministry of Health, Labour and Welfare (MHLW), “Summary of the Results of the National Health and Nutrition Survey, fiscal 2024” (2025) https://www.mhlw.go.jp/content/10900000/001603146.pdf
- MHLW, “Summary of the Results of the National Health and Nutrition Survey, fiscal 2023” (2024) https://www.mhlw.go.jp/content/10900000/001338334.pdf
- MHLW, “Summary of the Results of the National Health and Nutrition Survey, Reiwa 1 (2019)” (2020) https://www.mhlw.go.jp/content/10900000/000687163.pdf
- MHLW, “Summary of the Results of the National Health and Nutrition Survey, Heisei 20 (2008)” (2009) https://www.mhlw.go.jp/houdou/2009/11/dl/h1109-1b.pdf
- MHLW, “Dietary Reference Intakes for Japanese (2025 edition),” report of the review panel, Minerals (major minerals) https://www.mhlw.go.jp/content/10904750/001316468.pdf
- Ministry of Education, Culture, Sports, Science and Technology (MEXT), “Standard Tables of Food Composition in Japan (2020 Edition (Eighth Revised)), 2023 Supplement” https://www.mext.go.jp/a_menu/syokuhinseibun/mext_00001.html
- Food Labeling Standards (Cabinet Office Order No. 10 of 2015), e-Gov Law Search
- Consumer Affairs Agency, “Overview of the Nutrition Labeling System for Foods” https://www.caa.go.jp/policies/policy/food_labeling/nutrient_declearation/
- Tokyo Metropolitan Bureau of Public Health and Medical Services, nutrition labeling teaching materials, “Chapter 4: Nutrient Content Claims” https://www.hokeniryo.metro.tokyo.lg.jp/shokuhin/hyouji/kyouzai/files/eiyouseibun_chapter_4_kyoutyouhyouji.pdf
- Consumer Commission, Food Labeling Subcommittee, Material 3 (2014) https://www.cao.go.jp/consumer/history/03/kabusoshiki/syokuhinhyouji/doc/141003_shiryou3.pdf
- National Cancer Center Japan, “List of Evaluations of Cancer Risk and Preventive Factors” (ver.20260526) https://epi.ncc.go.jp/files/11_publications/E3818CE38293E4BA88E998B2E78FAD_matrix_260526_.pdf
- National Cancer Center Japan, cancer prevention booklet (ver.3.3) https://epi.ncc.go.jp/files/02_can_prev/cancer_prevention_brochure_3.3.pdf
- MAFF, “Watch Out for Too Much Salt”
- Funabashi City, “Recommendations for Cutting Salt”; Saitama City, “Let’s Keep Salt in Mind”
- Japanese Society of Hypertension, Committee on Salt Reduction and Nutrition
- WHO (2012) Guideline: Sodium intake for adults and children
- WHO (2023) WHO global report on sodium intake reduction
- WHO, “Sodium reduction” fact sheet
- U.S. Food and Drug Administration, “Sodium in Your Diet” https://www.fda.gov/food/nutrition-education-resources-materials/sodium-your-diet
- Anderson CA et al. (2010) Dietary sources of sodium in China, Japan, the United Kingdom, and the United States: the INTERMAP Study. J Am Diet Assoc. https://pubmed.ncbi.nlm.nih.gov/20430135/
- Koshida E et al. (2023) Global Comparison of Nutrient Reference Values, Current Intakes, and Intake Assessment Methods for Sodium. https://pubmed.ncbi.nlm.nih.gov/36858539/
- He FJ et al. (2013) Effect of longer term modest salt reduction on blood pressure. BMJ.
- Huang L et al. (2020) Effect of dose and duration of reduction in dietary sodium on blood pressure levels. BMJ. https://pubmed.ncbi.nlm.nih.gov/32094151/
- Filippini T et al. (2021) Blood Pressure Effects of Sodium Reduction: Dose-Response Meta-Analysis. Circulation. https://pubmed.ncbi.nlm.nih.gov/33586450/
- Strazzullo P et al. (2009) Salt intake, stroke, and cardiovascular disease: meta-analysis of prospective studies. BMJ.
- Aburto NJ et al. (2013) Effect of lower sodium intake on health: systematic review and meta-analyses. BMJ.
- Takachi R et al. (2010) Consumption of sodium and salted foods in relation to cancer and cardiovascular disease: the JPHC Study. Am J Clin Nutr. https://pubmed.ncbi.nlm.nih.gov/20016010/
- Ma Y et al. (2022) 24-Hour Urinary Sodium and Potassium Excretion and Cardiovascular Risk. N Engl J Med. https://pubmed.ncbi.nlm.nih.gov/34767706/
- O’Donnell M et al. (2014) Urinary sodium and potassium excretion, mortality, and cardiovascular events. N Engl J Med. https://pubmed.ncbi.nlm.nih.gov/25119607/
- Neal B et al. (2021) Effect of Salt Substitution on Cardiovascular Events and Death. N Engl J Med. https://pubmed.ncbi.nlm.nih.gov/34459569/
- Tsugane S et al. (2004) Salt and salted food intake and subsequent risk of gastric cancer among middle-aged Japanese men and women. Br J Cancer. https://pubmed.ncbi.nlm.nih.gov/14710219/
- Shikata K et al. (2006) A prospective study of dietary salt intake and gastric cancer incidence in a defined Japanese population: the Hisayama study. Int J Cancer. https://pubmed.ncbi.nlm.nih.gov/16450397/
- Ge S et al. (2012) Association between Habitual Dietary Salt Intake and Risk of Gastric Cancer: A Systematic Review of Observational Studies. https://pubmed.ncbi.nlm.nih.gov/23125851/
- Morais S et al. (2022) Salt intake and gastric cancer: a pooled analysis within the Stomach cancer Pooling (StoP) Project. https://pubmed.ncbi.nlm.nih.gov/35304655/
- Rakuten Ichiba, product pages for “Nitonya Yakiniku Za Punch 80 g” (Tenma Ichiba), and “Chotokusen Genen Shoyu (500 ml) [Choko]” and “Tanita Electronic Salt Meter Shiomikun SO-313-AWH” (Rakuten 24) (checked October 1, 2026)
Related articles and databases
- Why Did “No Chemical Seasoning” Disappear? Is Yeast Extract a Chemical Seasoning? How to Read Umami Seasonings and Hydrolyzed Protein
- Thyroid Cancer: Symptoms, Types, Rates in Japan and Abroad, the Effects of Iodine (Kombu) and Radiation, and Thyradin, TSH, Thyroglobulin and Tumor Markers
- Is Vinegar Good for You? Rice, Pure Rice, Grain, Black, and Apple Cider Vinegar Compared, and the “Acetic Acid for Blood Pressure and Visceral Fat” Research Checked
- Does aluminum leach from aluminum pans and foil? How it is made, why it is used, what happens when it builds up in the body, and how to choose alternative pans
- What Is Monosodium Glutamate (Umami Seasoning)? Checking the Claims About Petroleum, GMOs, Intake Limits, and a "Damaged Sense of Taste"
- What Is Nam Pla (Fish Sauce)? How It Is Made, How It Differs from Shottsuru, Ishiru, and Ikanago Soy Sauce, and Its Salt and Histamine Checked Against International Standards and Japan's Food Composition Tables
- Are Chili Peppers Good for You? How Capsaicin Makes Food Hot, the Scoville Scale, and What the Research Says About “Living Longer,” “Losing Weight,” and “Bad for the Stomach”