
Are Trans Fats Bad for You? Heart Disease Research, Global Regulation, Why Japan Has No Rules, High-Trans-Fat Foods and Japanese Intake

PR This article contains affiliate links to Rakuten Ichiba, Amazon and Yahoo! Shopping (“See on Rakuten”, etc.). What is written here is based on public agency sources and studies, regardless of whether any ads are present. The “See on Amazon.co.jp” links are also affiliate links.
“Margarine is full of trans fat, so it is bad for you.” “They are banned in the US and Europe, but Japan lets them run wild.” “Is the ‘zero trans fat’ on bread and sweets really zero?” These are the kinds of stories that follow trans fat around.
On the other hand, Japanese national agencies have assessed that “under a normal diet, the health impact is small.” Which is true?
In this article, we check the following against national statistics, laws, public agency documents and studies:
- When and how were trans fats discovered, and why did they become a problem?
- What happens in the body? How far can we go with the research on heart disease, cancer, dementia and so on?
- Where does global regulation stand? Why does Japan have neither a limit nor a labeling requirement?
- Which foods are high in trans fat? Is it true that salad oil has some too?
- How much do people in Japan eat? What is behind the average?
- What increased when trans fat was reduced? Why is “just go back to butter” not the answer?
- How to read “0 g” and “zero” on labels, and how to calculate the amount yourself
For every number, we state which survey it comes from, which year, and what is being measured.
Common questions, and where this article answers them
Google search suggestions (collected in Japanese on October 3, 2026) for words typed after “マーガリン” (margarine), “ショートニング” (shortening) and “トランス脂肪酸” (trans fat) came to 2,031 distinct terms in total. Counting those that fall under this article’s topic gave the following. This is not the number of searches, but “the range of questions people actually type.”
| Question | Matching suggestions | Where answered |
|---|---|---|
| Which foods are high? Rankings? | 67 | Foods high in trans fat |
| Is “zero” or “not used” really zero? | 57 | How to read labels and calculate it yourself |
| What about natural sources (butter, cheese, milk)? | 37 | Natural trans fat in milk and butter |
| Which countries ban it? Overseas rules? | 36 | How far has global regulation gone? |
| Which is worse, trans fat or saturated fat? | 27 | Comparing with saturated fat |
| Why is it bad? What is bad about it? | 25 | What happens in the body |
| Pregnancy, children, dementia, cancer, weight gain | 16 | Links with other diseases |
| Why doesn’t Japan regulate it? | 15 | Why doesn’t Japan regulate it? |
In English (the side more widely read outside Japan), the trend among suggestions is somewhat different. The English Wikipedia article “Trans fat” was viewed about 220,000 times a year (2024), more than five times the roughly 40,000 views of the Japanese article “トランス脂肪酸” (2024). However, overall Wikipedia views have dropped sharply since 2025, so we do not read year-to-year changes as a rise or fall in public interest.
The three-article series
- The margarine article: history, how it is made, differences from butter and fat spreads, and checking the “plastic” and “only in Japan” claims
- The shortening article: ingredients, why it is used in bread and sweets, the “carcinogenic” claim, and alternative fats
- The trans fat article: this article. The research, regulation, content and intake of trans fat itself
Conclusion
- Trans fats are fatty acids whose molecules have changed “shape.” They form when oil is hardened with hydrogen (partial hydrogenation), and also during the high-temperature “deodorizing” step in refining vegetable oil. They are also made by microbes in the stomachs of cows and sheep, so milk, butter and beef contain natural trans fat
- Two points are solid: LDL cholesterol in the blood goes up and HDL goes down (feeding trials with set diets), and there is an association with coronary heart disease (follow-up studies). In a 1990 trial (59 people, 3 weeks per diet), LDL was 14 mg/dL higher and HDL 7 mg/dL lower. In a 2015 meta-analysis, people with high trans fat intake had 1.21 times the coronary heart disease, and 1.42 times when limited to industrial sources
- No trial has examined heart disease itself. Follow-up studies are observational studies based on food questionnaires, so we cannot say they prove “cause.” For cancer, dementia, infertility, depression, diabetes and allergy, studies are split and causation cannot be stated (the Food Safety Commission of Japan says “cannot conclude” for many of them)
- Japan has neither a content limit nor a labeling requirement. The term “trans fatty acids” appears 0 times in the Food Labeling Standards (2015), and companies disclose voluntarily following a Consumer Affairs Agency guideline (2011). “0 g” may be written when the amount is under 0.3 g per 100 g. The stated reason for not regulating is “the average Japanese intake is under 1% of energy,” and the government says it will “consider regulation or mandatory labeling if an upward trend appears”
- Worldwide, by the end of 2023, 53 countries (46% of the world’s population) had implemented policies that the WHO calls “best practice.” Japan is not among them. A WHO report lists Japan as one of “eight countries that could cut 90% of the global burden by adopting new policies.” However, the “average intake” that Japan’s assessment looks at and the “number of countries and population” that the WHO looks at are different yardsticks
- Trans fat concentrations in Japanese foods have dropped a lot even without regulation. In MAFF survey medians, margarine went 8.7 → 0.99 → 0.65 g/100 g and shortening 12 → 1.0 → 0.61 g/100 g (FY2006-07 → FY2014-15 → FY2022-23; sampling differs, so these are not simple increases or decreases). Salad oil has about 1.2 g/100 g, more than today’s margarine (it forms in the deodorizing step of refining)
- Average Japanese intake is 0.3% of energy (FSCJ) to 0.6% (back-calculated from production), below the WHO target of under 1%. However, the top 5% of boys aged 1–6 is at 1.02%, and in a food-record study 24% of women aged 30 and over exceeded 1%. Talking only about the average misses something
- Saturated fat rose in some respects as trans fat was cut. In an FSCJ survey, average saturated fat rose 1.4 times in commercial-use margarine and 1.9 times in commercial-use shortening (FY2006 → FY2010; the commercial-use samples are not re-measurements of the same brands). But “just go back to butter” is not the answer either. Per 10 g, butter has 2.2 times the saturated fat of household margarine
Items featured in this article
| Item | When it is useful | Where in the article |
|---|---|---|
| Cooking oils with a small published trans fat value (e.g., extra virgin olive oil) | When you want to choose frying or stir-frying oil by its published value | Salad oil has some too, because of the deodorizing step |
When and how were trans fats discovered?
The history of trans fat is the history of the “technology for solidifying liquid oil.” The histories of margarine and shortening are in the margarine article and the shortening article, respectively. Here we trace only the parts related to trans fat.
The technology to harden oil is born (1901–1911)
- It was at the end of the 1890s that Sabatier of France discovered the reaction of adding gaseous hydrogen using nickel (hydrogenation) (he later won the 1912 Nobel Prize in Chemistry)
- Normann of Germany is reported to have succeeded, on February 27, 1901, in the first experiment in which solid nickel and gaseous hydrogen were made to act on liquid oleic acid to obtain hard stearic acid. The German patent was granted in 1903 (effective from August 14, 1902), and the British patent in 1903 (the American Oil Chemists’ Society, AOCS, and patent records)
- In June 1911, the US company P&G launched “Crisco.” It was a white fat made by hardening vegetable oil (cottonseed oil), a substitute for lard. Sales jumped from 2.6 million pounds in 1912 to 60 million pounds in 1916 (AOCS)
It started early in Japan as well. In 1908 Mitsumaru Tsujimoto of the Industrial Experiment Laboratory of the Ministry of Agriculture and Commerce succeeded in hydrogenating fish oil, and the British-owned Lever Brothers built the first hardened-oil factory in Japan and Asia, in Amagasaki (built in 1910, production began in 1913). Raw materials were fish oil and soybean meal, and most of the product went to China. At the time, large amounts of Japanese fish oil were also exported to Europe as raw material for hardened oil (Catalysis Society news; a secondary source).
Nobody noticed that “trans forms” were being made
In 1920, the US Supreme Court invalidated the main part of P&G’s Crisco patent (the Burchenal patent) (Berlin Mills v. P&G). The AOCS writes that chemists at the time did not recognize that partial hydrogenation produced “elaidic acid,” a trans fatty acid.
In other words, trans fat was not “used knowing it was harmful”; it was a by-product that increased unnoticed as oil was solidified.
What is a trans form?
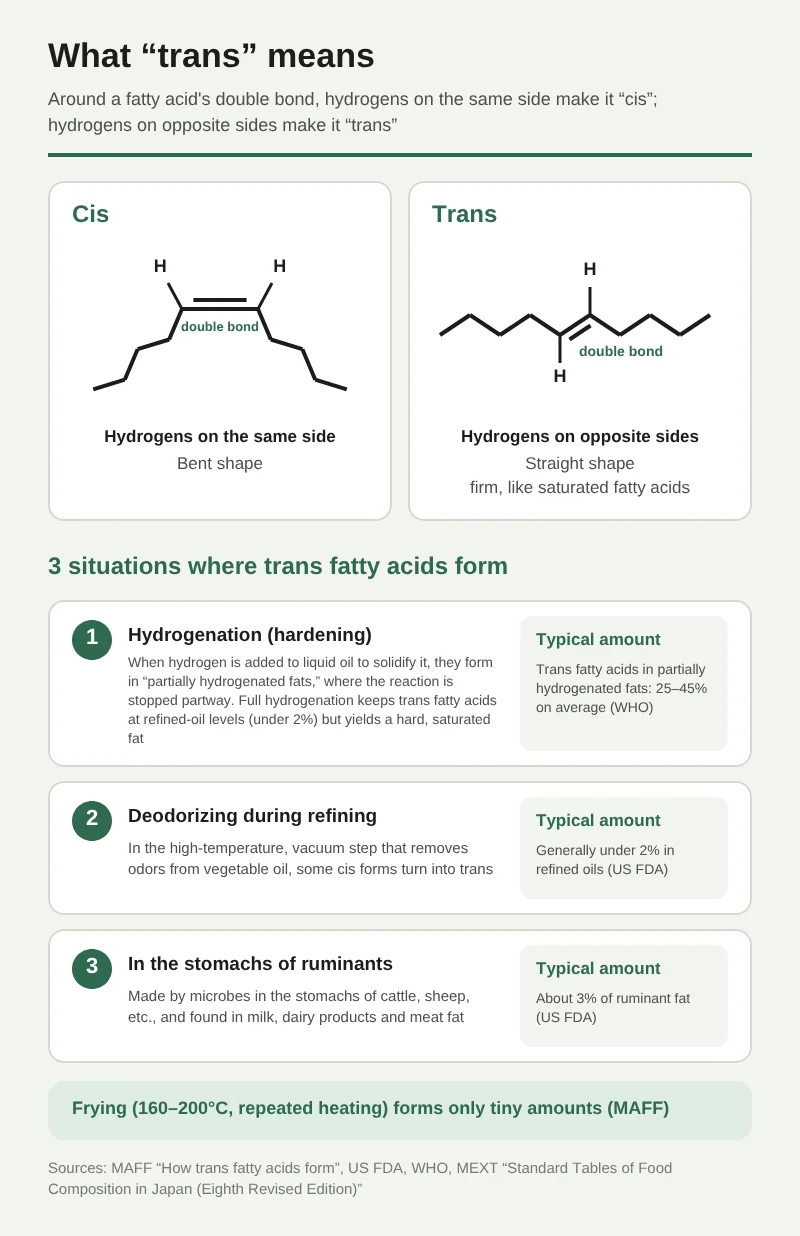
Fatty acids contain a part called a “double bond” within a chain of carbons. If the hydrogens attached around the double bond are on the same side, it is the “cis form”; if on opposite sides, the “trans form.” The explanation in MEXT’s food composition tables says they differ in “the arrangement of hydrogen atoms attached to the carbon atoms that have the double bond.” The cis form is bent and the trans form is straight, and the straight one has a firmness similar to saturated fatty acids.
According to MAFF’s explanation, trans fat forms in the following three situations.
| Where it forms | What happens | Guide to the amount |
|---|---|---|
| Hydrogenation (hardening) | When liquid oil is solidified by adding hydrogen, it forms in “partially hydrogenated fats” where the reaction is stopped midway | WHO puts trans fat in partially hydrogenated fats at 25 to 45% on average |
| “Deodorizing” in refining | In the high-temperature, vacuum step that removes the smell of vegetable oil, some cis forms change to trans forms | In refined oils, generally under 2% (US FDA) |
| Inside the stomachs of ruminants | Microbes in the stomachs of cows, sheep and so on make it, and it enters the fat of milk, dairy products and meat | About 3% of ruminant fat (US FDA) |
MAFF writes that frying (160 to 200 degrees C, repeated heating) also produces only a very small amount, with a negligible effect (the WHO says “an increase of around 2 to 3%”).
“Partial hydrogenation” and “full hydrogenation” are different things. The US FDA distinguishes oils hydrogenated until the iodine value (how much unsaturation remains) is 4 or below as fully hydrogenated oils, and those above 4 as partially hydrogenated oils. In a fully hydrogenated oil, the unsaturated portions have almost all turned into saturated fatty acids, so trans fat is about the same as in refined oil (under 2%). But the result is a hard saturated-fat oil. We come back to this in “What increased when trans fat was reduced?” later.
The era when it was said to be “healthier than butter”
In the US, in 1958, margarine first exceeded butter in per-capita annual consumption (8.9 pounds of margarine, 8.4 pounds of butter; US Department of Agriculture). Margarine consumption peaked at about 12 pounds in 1976.
Behind this was the idea that animal saturated fat was linked to heart disease. In 1961 the American Heart Association (AHA) recommended replacing saturated fat with polyunsaturated fat. As for trans fat, however, science at the time also considered “the concern to be small.”
- The Federation of American Societies for Experimental Biology (FASEB, commissioned by the FDA) reported, according to a petition from the US consumer group CSPI, in 1976 that for hardened soybean oil there was “no evidence of hazard to the public,” and in 1985 that “there is little reason for concern about safety at either current or future expected intakes” (this is a quotation; we have not checked the original)
- In 1989, the FDA also judged partially hydrogenated fish oil (menhaden oil), used in margarine in Europe, to be “generally recognized as safe (GRAS)” (also quoted from the same petition)
The turning point of 1990
In 1990, the Dutch researchers Mensink and Katan published the results of a randomized trial. From here, the view changed (details in the next chapter).
| Year | Event |
|---|---|
| August 1990 | Mensink and Katan trial (NEJM). Trans fat raises LDL and lowers HDL |
| March 1993 | Willett et al. follow-up study (Lancet). Among 85,095 nurses, coronary heart disease 1.50 times |
| 1993–94 | US consumer group CSPI sends the FDA a letter and petition asking for trans fat labeling |
| November 1999 | FDA publishes a labeling proposal. The CSPI petition quotes the FDA itself as writing that “reports of the late 1980s suggested no adverse effects” |
| 2003 | WHO and FAO recommend under 1% of total energy. Denmark creates a rule |
| January 2006 | In the US, listing trans fat in the nutrition facts becomes mandatory |
| June 2015 | FDA makes its final determination that partially hydrogenated oils are not “generally recognized as safe” (compliance deadline June 18, 2018) |
| May 2018 | WHO announces “REPLACE,” aiming to eliminate industrially produced trans fat by 2023 |
Note that the WHO’s goal of “elimination by the end of 2023” was not achieved. The goal has been revised to “virtual elimination by 2025.”
What happens in the body
Research on trans fat is plentiful but varies in strength. In this chapter we separate the solid parts (blood lipids and coronary heart disease) from the unsolid parts (other diseases), and lay them out with the type of study, number of people, duration and funding.
Blood LDL goes up and HDL goes down
The most solid finding is the effect on blood lipids. It has been confirmed repeatedly in trials where people eat set diets.
The 1990 trial by Mensink and Katan (NEJM) is a classic that is still cited today.
- Participants: 59 healthy people (34 women and 25 men, average age 25–26)
- Method: they ate three kinds of diets for 3 weeks each, in an order decided by lot (randomized crossover trial). 10% of energy was set as oleic acid (a cis-form oil), trans oleic acid, or saturated fat
| Diet (10% of energy) | Change in LDL (“bad”) | Change in HDL (“good”) |
|---|---|---|
| Oleic acid (baseline) | 0 | 0 |
| Trans oleic acid | 14 mg/dL higher (0.37 mmol/L) | 7 mg/dL lower (0.17 mmol/L) |
| Saturated fat | 18 mg/dL higher (0.47 mmol/L) | No difference |
Saturated fat also raises LDL, but it does not lower HDL. Trans fat differs from saturated fat in that it raises LDL and also lowers HDL. This trial is the source of the saying that “trans is worse than saturated fat in that it lowers HDL.”
A summary of later research:
- In an analysis pooling 60 trials (Mensink et al., 2003), the effect on the total cholesterol/HDL ratio of replacing trans fat with carbohydrate and cis unsaturated fat was about twice the effect of replacing saturated fat. The Dietary Reference Intakes for Japanese (2025 edition) also uses the same “about 2 times” in its calculation (citing the 1999 summary by Ascherio et al.)
- In an analysis pooling 7 randomized trials (Aronis et al., 2012), total cholesterol and LDL went up and HDL went down. On the other hand, blood glucose, insulin and triglycerides did not change
- The WHO’s 2023 guideline, in an analysis of 16 trials (680 people), says that replacing 1% of trans fat with polyunsaturated fat lowers LDL by 0.048 mmol/L (certainty “high”)
Note, however, that the amounts used in trials are higher than in everyday diets. The 10% in the Mensink et al. trial is more than 30 times the average Japanese intake (0.3% of energy) (Urayomi’s calculation). A review (2017) by Japanese researchers looking back at a series of trials in Japanese people suggests that “industrial trans fat under 1% does not affect serum cholesterol,” but also writes that trials at low doses are themselves few and there is no firm evidence for an acceptable upper limit.
Association with coronary heart disease
The other solid finding is the association with coronary heart disease (a disease in which the blood vessels of the heart narrow). This has been studied in “follow-up studies (cohort studies),” which track people for a long time based on food questionnaires.
| Study | Participants and duration | Result (ratio of high to low groups) |
|---|---|---|
| Nurses’ Health Study (Willett et al., 1993) | 85,095 US women, 8 years, 431 coronary heart disease cases | Highest quintile was 1.50 times the lowest group (1.12–2.00). Among 69,181 who had eaten margarine steadily for 10 years, 1.67 times |
| Nurses’ Health Study (Hu et al., 1997) | Same study, 80,082 women, 14 years, 939 cases | Replacing 2% of energy from carbohydrate: 1.93 times (1.43–2.61) |
| Nurses’ Health Study (Oh et al., 2005) | Same study extended to 20 years, 78,778 women, 1,766 cases | Highest group 1.33 times (1.07–1.66). Under age 65, 1.50 times |
| Chowdhury et al. (2014) | Pooled 32 observational studies, 530,525 people | Coronary heart disease 1.16 times (1.06–1.27). In the same analysis, saturated fat was 1.02 times (0.97–1.07), no association |
| de Souza et al. (2015, BMJ) | Pooled observational studies | All-cause death 1.34 times, coronary heart disease death 1.28 times, coronary heart disease 1.21 times. Stroke 1.07 times and type 2 diabetes 1.10 times not significant |
| Analysis cited in the WHO guideline (2023) | Pooled prospective observational studies | For each 2% of energy increase, coronary heart disease 25% higher and all-cause death 14% higher (certainty “moderate”) |
The values in parentheses are 95% confidence intervals (the range in which the true value is thought to lie).
What we can see is as follows:
- Results range from 1.16 to 1.93 times depending on the study. The participants and the way of counting (quintile comparison, 2% increase comparison) differ, so they cannot be lined up and ranked
- Looking at industrial sources only, coronary heart disease was 1.42 times (1.05–1.92) (de Souza et al.)
- For stroke and type 2 diabetes, the confidence intervals crossed 1 and the association was unclear
These are all observational studies. People who eat a lot of margarine, cookies, cakes and white bread may differ in other lifestyle habits too. Food questionnaires cannot measure the amount eaten accurately. Furthermore, no study has tested in a trial whether reducing trans fat reduces heart disease (the FSCJ assessment also writes that the effect of reducing it further in Japanese people is “unknown”). The WHO guideline also evaluates them separately: blood lipids from trials, disease from observational studies.
Natural trans fat in milk and butter
Does natural trans fat act the same as the artificial kind? Interpretation is split among researchers.
| Study | Content | Caveats |
|---|---|---|
| Brouwer et al. (2010) | Pooled 39 human trials. The rise in the LDL/HDL ratio per 1% of energy was 0.055 for industrial, 0.038 for ruminant, 0.043 for CLA; the differences were not significant | Conclusion: “anything with a trans double bond raises the LDL/HDL ratio” |
| TRANSFACT trial (2008) | 46 people (40 completed) ate about 5% of energy (11–12 g a day). Compared with industrial, only in women, natural sources gave higher HDL and LDL | The amount was extreme and not an ordinary diet |
| Gayet-Boyer et al. (2014) | Pooled 13 trials on ruminant sources. Up to 4.19% of energy, no effect on lipid ratios | The first author’s affiliation was a French dairy industry body (CNIEL) |
| Follow-up study (de Souza et al., 2015) | Ruminant sources and coronary heart disease: 0.93 times (0.73–1.18), no association visible | Explained as due to low intake |
| WHO guideline (2023) | Does not distinguish between industrial and natural sources. When intake of natural sources is aligned at 0.7–1.3%, the association with coronary heart disease disappears. In trials, natural sources above 2% raised LDL as much as or more than industrial | Position: there is not enough evidence to distinguish |
| Food Safety Commission of Japan (2012) | Considers that for Japanese people the relationship with coronary heart disease is lower for ruminant sources, but evaluated trans fat as a whole |
In short, we cannot say either “natural means harmless” or “natural is just as harmful.” The view of many researchers is that differences are hard to see because intake of natural sources is small.
How much natural trans fat is there in practice?
- In a MAFF survey, butter had 1.9 g/100 g (FY2006-07, 13 samples). “Foods mainly made from dairy ingredients” with uses similar to butter or margarine had 1.0 g/100 g (FY2022-23, 24 samples), the item with the highest median in that year’s survey
- Averages measured by the FSCJ were 0.091 g/100 g for milk, 0.521 g/100 g for beef, and 0.826 g/100 g for processed cheese and the like (FY2006)
- Of Japanese intake, dairy contributes 0.13 g a day and meat 0.11 g, together about one quarter (MAFF Total Diet Study, FY2005–07)
- In an old US Department of Agriculture analysis, salted butter was 3.28 g/100 g. But the years and analytical methods differ, so it cannot be set beside the Japanese values to draw a conclusion
Incidentally, “ghee” (oil made from butter) is not listed in Japan’s food composition tables. The trans fat in the US Department of Agriculture table is “0.0 g,” but this is likely a missing, unanalyzed value, and we could not confirm a reliable figure.
Links with other diseases
You often hear about links with cancer, dementia, infertility, depression and so on. From here on, most are observational studies, and causation cannot be stated.
| Disease | Study | What was found | Can causation be stated? |
|---|---|---|---|
| Dementia | Chicago study (Morris et al., 2003): 815 people aged 65+, about 4 years | Compared with the lowest trans fat group, Alzheimer’s disease was 2.4 times in the second and higher groups | Observational study with few people |
| Dementia | Hisayama Study (Honda et al., 2019): 1,628 people aged 60+, median 10.3 years | When blood elaidic acid (a marker of industrial sources) was high, dementia and Alzheimer’s disease were more common. No association with vascular dementia | One of few studies in Japanese people. Blood at a single time point |
| Dementia | Systematic review (2022) | “No robust association for any fatty acid.” Certainty is insufficient | Cannot be stated |
| Infertility | Nurses’ Health Study II (Chavarro et al., 2007): 18,555 women, 438 cases of ovulatory infertility | 1.73 times per 2% of energy increase | Observational study. The mechanism is a hypothesis |
| Depression | Study of Spanish university graduates (2011): 12,059 people, median 6.1 years | Highest quintile 1.42 times | Observational study |
| Type 2 diabetes | Pooled follow-up studies (2015), pooled trials (2012), blood markers in 12 cohorts (2022) | No association visible | No clear harm visible |
| Cancer | Pooled 46 observational studies (2021) | Prostate cancer 1.49 times and colorectal cancer 1.26 times significant; breast cancer 1.12 times not significant. Large variation | Looking only at follow-up studies, breast cancer 1.02 times and colorectal cancer 1.03 times, no association |
| Allergy | Comparison across 10 European countries (1999) and others | Country-level comparisons do not show individual-level associations | Cannot be stated |
For dementia, see the article on oils and dementia/depression for details.
The FSCJ’s summary (2012) is as follows:
- Coronary heart disease: likely to increase it (however, compared with risk factors in Japanese people such as smoking, diabetes and high blood pressure, the coronary heart disease risk from trans fat is “considerably small”)
- Obesity and allergic diseases: associated (obesity showed a positive association in two cohorts, and in a monkey trial body weight and visceral fat tended to increase). In pregnant and nursing women, associations with reduced fetal weight, miscarriage and stillbirth have been reported
- Diabetes, cancer, gallstones, stroke, age-related macular degeneration, dementia: cannot conclude
So we cannot write “trans fat causes dementia” or “causes infertility.” “An association has been reported” is as far as current research can go.
Where the “1.94 times” and “500,000 people” numbers come from
The numbers that show the “harm” of trans fat have spread mixed together with different premises. We lined up commonly seen numbers by their source.
| Commonly seen number | Source | Caveats |
|---|---|---|
| Heart attack risk 1.94 times | A 1994 US case-control study (239 patients, 282 controls) that the FSCJ Q&A gave as an example | The ratio of the highest to the lowest quintile of plant-derived trans fat; the confidence interval is 0.93–4.04 (crosses 1). It is a survey in which people recall their diet 8 weeks after hospital discharge, so recall bias may enter. In the same study ruminant sources were 1.02 times (0.43–2.41). The assessment called it a “significant increase” on the strength of the trend test (p<0.001) |
| 500,000 deaths a year | Estimate by Wang et al. (2016): in 2010, 537,200 coronary heart disease deaths (7.7% of the total) were attributable to trans fat. The WHO announced “over 500,000 a year” in 2018 and “up to 500,000” in January 2023 (the scale is close, but we have not confirmed whether it is the same calculation) | An estimate that includes natural sources. This paper has two Errata, but we have not checked their content |
| Over 278,000 deaths a year | WHO fact sheet (2024) and 2023 report | An estimate for industrial sources only. The method and year differ from the 500,000 above |
| All-cause death 34%, coronary heart disease death 28%, coronary heart disease 21% higher | De Souza et al. (2015) numbers cited in the WHO fact sheet | Numbers for total trans fat including natural sources. With industrial sources only, coronary heart disease is 1.42 times and coronary heart disease death 1.18 times |
| Coronary heart disease 23% higher per 2% of energy | Meta-analysis (2006) cited in the FSCJ assessment | The original number was confirmed through the assessment’s citation (secondhand) |
The 1.94 times is a number better not quoted on its own. It is a number in a national agency Q&A, but the confidence interval in the original paper crosses 1.
Japan’s official assessment: “under a normal diet, the health impact is small”
How does the Japanese government evaluate trans fat?
The Food Safety Commission of Japan (March 2012) concluded in its assessment as follows:
- The great majority of Japanese people are below the WHO target (under 1% of energy), and under a normal diet, the health impact is small
- However, people with a diet skewed toward fat need to be careful
- Trans fat is not essential to humans and should be kept as low as possible. Also be mindful of the saturated fat that increased along with the reduction
The assessment is backed by studies from Europe and the US, and also writes that “it is not clear whether intake at Japanese levels is associated with disease risk.”
The MHLW’s “Dietary Reference Intakes for Japanese (2025 edition)” sets no target value for trans fat. This is because Japanese intake is lower than in Europe and the US and reports of effects are insufficient. However, saying “this does not mean the current state is fine,” it states as a reference value that under 1% of energy, as low as possible, is desirable.
For readers who want to read more of the research
How far has global regulation gone?
The WHO recommendation and the number of countries implementing it
The WHO recommends keeping trans fat under 1% of total energy (recommended by the WHO and FAO in 2003; strongly recommended up to 1% in the 2023 guideline). For a 2,000 kcal diet, that is under 2.2 g a day. This is a “target,” not a “permissible amount” meaning that anything at or below it daily is safe.
As the “best policy” for eliminating industrially produced trans fat, the WHO recommends enacting into law either of the following:
- Set a limit of 2 g of industrial trans fat per 100 g of fat in foods
- Ban the production and use of partially hydrogenated oils
| Point in time | Countries implementing this policy | Share of population | Source |
|---|---|---|---|
| 2018 (start of REPLACE) | 11 countries | 6% | WHO (May 2025 announcement) |
| End of 2023 | 53 countries (3.7 billion people) | 46% | WHO (January 2024 announcement, 5-year report) |
| May 2025 | About 60 countries | 46% | WHO (May 2025 announcement) |
How to count (in force, or merely passed) differs by source, so this does not match the “7 countries in 2015 → 14 countries in 2020 → 60 countries in October 2024” cited by MAFF. Read each figure together with its year. The 53 countries counted as implementing at the end of 2023 include the US, Canada, Brazil, India, Thailand, Saudi Arabia and many European countries. Japan, China, South Korea, Australia and New Zealand are not included.
The WHO also issues “validation certification” to confirm that the policies countries have implemented are actually working. So far 11 countries have been recognized. Denmark, Lithuania, Poland, Saudi Arabia and Thailand in 2024, Austria, Norway, Oman and Singapore in May 2025, and then Portugal and the United Arab Emirates have been added (WHO page, checked October 3, 2026). Japan is not included.
Rules by country
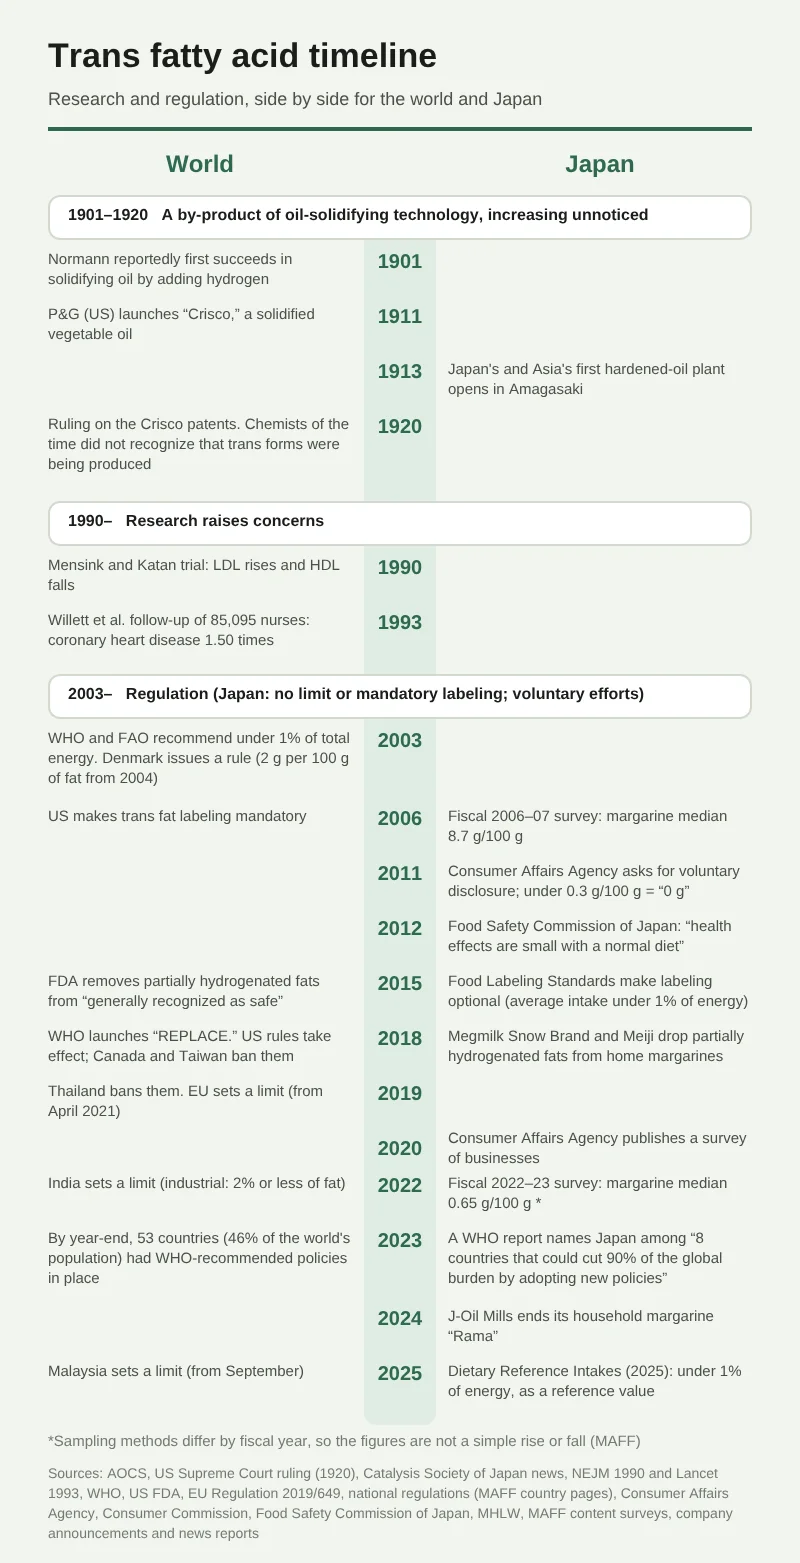
Regulatory approaches fall broadly into two types: setting a limit on content (Denmark, the EU and others) and banning partially hydrogenated oils (the US, Canada, Thailand, Taiwan and others).
| Country/region | Approach | Content | Start |
|---|---|---|---|
| Denmark | Limit | Bans over 2 g per 100 g of fat in the final product (natural sources excluded) | Rule in 2003, 2 g from January 2004 |
| Switzerland | Limit | Bans over 2 g per 100 g of edible vegetable fat | April 1, 2008 |
| Austria | Limit | Bans manufacture and distribution of foods with 2 g or more per 100 g of total fat | 2009 |
| US | Ban | Removed partially hydrogenated oils from “generally recognized as safe.” Nutrition facts labeling mandatory since 2006 | Regulation began June 18, 2018 (distribution allowed to continue until 2020–21) |
| Canada | Ban | Bans use of partially hydrogenated oils. First in the world to make labeling of packaged foods mandatory | Ban September 17, 2018; labeling 2005 |
| EU | Limit | Regulation 2019/649: retail foods up to 2 g per 100 g of fat (natural sources excluded) | Grace period until April 1, 2021 |
| Taiwan | Ban | Bans partially hydrogenated oils with an iodine value above 4 (full hydrogenation allowed) | July 1, 2018 |
| Thailand | Ban | Bans manufacture, import and sale of partially hydrogenated oils and foods using them | January 9, 2019 |
| Singapore | Ban | Bans import of fats containing partially hydrogenated oils and their use as an ingredient | June 1, 2021 |
| India | Limit | Industrial sources at 2% or less of fat (natural sources excluded) | January 1, 2022 |
| Hong Kong | Ban | Bans use of partially hydrogenated oils in food and import of fats containing them | December 1, 2023 |
| Malaysia | Limit | Bans sale and the like of foods with 2 g or more per 100 g of fat (excluding that from animal fat) | September 1, 2025 |
| China, South Korea | Labeling | Labeling mandatory (not a limit regulation) | Korea December 2007, China January 2013 |
| Australia, New Zealand | None | No regulation. Labeling required only when a claim is made | ― |
| Japan | None | No limit or labeling requirement (voluntary disclosure) | ― |
There are three points to note in reading the table:
- The US decision is not a ban on “trans fat”; it removes “partially hydrogenated oils (PHO)” from the “generally recognized as safe” category. Fully hydrogenated oils and natural trans fat in milk and beef are outside its scope. The story that “margarine was banned in America” is a misunderstanding rooted in this decision (details in the margarine article)
- Thailand’s Q&A writes that it is “not a ban on trans fat being detected in food.” Even in countries with a ban, traces remain
- The “2 g” limit is per 100 g of fat, not per 100 g of food. The denominator differs, so it cannot be mixed with the “g/100 g” of Japan’s MAFF survey for comparison
What happened after regulation
There are studies that examined the effect of regulation. Both are observational studies called “natural experiments,” and are not proof of causation.
- Denmark (first in the world to regulate, in 2004): compared with a control built from OECD countries, cardiovascular disease deaths were about 14.2 per 100,000 people per year lower in the 3 years after regulation (Restrepo and Rieger, 2016). The share of products over 2 g fell from 26% (2002-03, 253 products) → 11% (2004-05) → 9% → 7% (2010) → 6% (2012-13, 95 products)
- New York State: comparing 11 counties that regulated restaurants and the like with 25 counties that did not, hospital admissions for heart attack and stroke were 6.2% lower after 3 or more years (heart attack down 7.8%, stroke down 3.6% but not significant; Brandt et al., 2017)
On the other hand, there is also a study showing that voluntary reduction alone is not enough. In 6 countries of southeastern Europe, biscuits and cakes bought in countries without regulation in 2012 and 2014 were tested. Products with industrial trans fat at 2% or less of fat rose from 69 to 235, but products above 2% also doubled, from 33 to 68 (Stender et al., 2016).
Denmark has one more caveat. In MAFF’s summary, comparing products tested twice, in more than two thirds, industrial trans fat had been replaced mainly with saturated fat from coconut oil and palm oil. We take this up later in “What increased when trans fat was reduced?”
Why doesn’t Japan regulate it?
Japan’s system: no limit and no labeling requirement
Let us lay out Japan’s rules.
- In the Food Labeling Standards (2015), the term “trans fatty acids” appears 0 times (Urayomi searched the full text on e-Gov). In the same standards, saturated fat and dietary fiber are “recommended labeling,” but trans fat is not listed
- The Consumer Affairs Agency’s “Guideline on Disclosure of Information on Trans Fatty Acids,” issued on February 21, 2011, “requests” voluntary disclosure by companies. If labeled, the definition follows the Codex Alimentarius Commission, the unit is g, and the margin of error is up to plus 20%. “0 g” may be written when the amount is under 0.3 g per 100 g (100 ml) of food
- The fatty acid tables of the Standard Tables of Food Composition in Japan (8th revision) also have no trans fat column. Looking it up in the composition tables does not give a value
- MAFF has chosen trans fat as one of the “harmful chemicals for which risk management should be given priority,” and investigates the content in foods in set fiscal years
The reason for not regulating is that “intake is low”
When the Food Labeling Standards were drafted in 2015, the Food Working Group of the Consumer Commission discussed the matter and issued its summary in May 2015.
- The reason for choosing voluntary rather than mandatory labeling was that the estimated intake of the average Japanese person was, at that point, under 1% of energy
- However, it also writes that if, even with continued voluntary efforts, a trend of rising intake is seen in the future, the responsible ministries and agencies need to consider regulation setting a content limit or mandatory labeling
In other words, the basis for having no regulation is “the numbers,” not a permanent conclusion. The summary also writes that since trans fat is not essential to humans, reduced intake is desirable, that care should be taken so that saturated fat does not increase along with the reduction, and that information should be provided to young people, women in their 20s to 50s and caregivers of children.
How much do companies disclose?
In June 2020 the Consumer Affairs Agency published a survey of businesses. It was mailed to 2,405 domestic food manufacturers, and 942 responded (response rate 39.2%).
| Item | Result |
|---|---|
| Among businesses saying some of their products contain trans fat, those who know the content | 66.1% |
| Among the same businesses, those working on reduction | 33.9% |
| Among the same businesses, those communicating information to consumers | 14.3% (websites 52.6%, product packaging 26.3%) |
| Reasons for not communicating (multiple answers) | Do not know the content 31.1% / Intake is said to be at a level with no effect on the body 28.4% / Competitors do not disclose either 28.4% / Consumers have never asked 28.4% / Analysis costs money 26.6% |
By product category, “vegetable fats and oils (blended cooking oil, etc.)” and “margarines (including fat spreads)” were at the top.
Japan as seen by the WHO
The WHO’s 2023 report names Japan. If 8 countries (Japan, China, Indonesia, Azerbaijan, Iran, Morocco, Pakistan and Russia) newly adopted best-practice policies, 90% of the global burden of industrial trans fat could be cut. The report’s appendix estimates that 1.82% of Japan’s coronary heart disease deaths are attributable to trans fat (intake above 0.5% of energy).
There are two caveats here:
- The 1.82% is an estimate from a model, the IHME’s GBD 2019, not a measurement. The threshold (0.5%) also differs from the view in Japan’s assessment. Countries with large populations contribute greatly to global deaths even at a low rate
- Sources disagree on Japan’s standing. MAFF (updated November 2024) explains it as “score 2 (a country taking other complementary measures) of the WHO’s four levels of national action,” but in the report’s appendix the score cell for Japan is blank (–) and no description of measures is written. We could not confirm which is more recent
Japan’s assessment (under a normal diet the effect is small) and the WHO’s view (whether countries with large populations move) use different yardsticks. This is not a case of one being wrong.
Even without regulation, ingredients were swapped
Even with no regulation, trans fat in Japanese foods has decreased. One trigger was developments and press coverage in the US.
- In March 2018, Snow Brand Megmilk (14 products, per FoodNavigator-Asia) and Meiji (10 products) stopped using partially hydrogenated oils in the ingredients of household margarines. Snow Brand Megmilk explained that the image of margarine as a food high in trans fat had spread, leading consumers to buy less (per a Nikkan Kogyo Shimbun report). Meiji wrote in its materials that what the US excluded was not “trans fat” but “partially hydrogenated oils,” yet in Japan it was reported as if the former had been banned (company explanation)
- J-Oil Mills ended the manufacture and sale of “Rama” (launched 1966), a household margarine (last shipment end of March 2024). It explains the reasons as aging production equipment and market trends. It continues commercial-use products
Urayomi re-tabulated material on raw material usage from the Japan Margarine Industry Association. The share of hardened oil (partially plus fully hydrogenated) in margarine ingredients fell from 10.2% (2016) to 3.2% (2025). For shortening, it went from 14.2% to 7.9%. In their place, interesterified oil rose from 31% to 39%. Hardened fish oil used in margarines went from 4,380 t to 224 t.
However, this is a figure for the association’s member companies only, and it includes fully hydrogenated oil. It is not the share of partially hydrogenated oil alone.
Foods high in trans fat
The Ministry of Agriculture, Forestry and Fisheries (MAFF) has repeatedly surveyed how much trans fat is in Japanese foods. This survey is also the source of any “ranking of high-trans-fat foods.”
| Survey | Overview |
|---|---|
| FY2006-07 (Heisei 18-19) | A table combining the Food Safety Commission of Japan’s FY2006 survey with a survey commissioned by MAFF. MAFF cautions that “the number of samples is small, so this is a rough guide” |
| FY2014-15 (Heisei 26-27) | For margarine, fat spreads and shortening, both household and commercial use. Products were chosen without regard to sales volume |
| FY2016 | Fried foods and cooked frozen foods |
| FY2022-23 (Reiwa 4-5) | 27 items, 522 samples. Chosen considering sales volume. Analytical methods are international (AOCS Ce 1h-05, etc.) |
As MAFF writes that “differences between the results of each survey do not simply represent increases or decreases,” the way samples were taken differs. They cannot be read as simple increases or decreases.
In order of highest in FY2022-23
In order of highest median per 100 g:
- Dairy-based foods with uses similar to butter or margarine (butter-flavored spreads, etc.) 1.0
- Margarine 0.65
- Vegetable fats and oils (including blended cooking oil and solid fats) 0.64
- Shortening 0.61
- Fat spread 0.48, wafers 0.46, curry, hayashi and stew roux 0.46
The points to look at are these:
- Even for the highest item, the median is about 1 g per 100 g. This is very different from the 12 for shortening and 8.7 for margarine in FY2006-07
- Only for roux, the maximum of the range is 7.0. Within the same item it spans from 0.09 to 7.0. Averages and medians alone cannot show this “outlier” (curry roux is covered in the curry roux article)
- Loaf bread is 0.03, pudding 0.04 and sweet buns 0.08, so medians for bread and sweets are low. However, some items, like croissants, spread up to a maximum of 2.3 even with a median of 0.20
Lining up the three surveys
The median for margarine per 100 g was 8.7 (FY2006-07) → 0.99 (FY2014-15) → 0.65 (FY2022-23) and for shortening 12 → 1.0 → 0.61. Fat spread was 6.1 → 0.69 → 0.48. Talking only about medians hides outliers. For shortening in FY2014-15, the maximum was 24. In FY2022-23 the maximum is 0.86.
By item, it looks like this:
| Item | FY2006-07 | FY2014-15 | FY2022-23 |
|---|---|---|---|
| Pie confections | 5.9 | 0.58 | 0.20 |
| Semi-moist cakes | 2.4 | 0.17 | 0.13 |
| Mayonnaise (including types) | 1.3 | 0.95 | 0.39 |
| Croissants | 0.82 | 0.54 | 0.20 |
| Curry and hayashi roux | 0.88 (curry) / 2.7 (hayashi) | 0.52 | 0.46 |
| Doughnuts | 0.42 | 0.30 | 0.16 |
| Loaf bread | 0.077 / 0.19 (two surveys) | 0.03 | 0.03 |
| Biscuits | 0.31 | 0.14 | 0.18 (cookies included) |
| Rice crackers | 0.19 | 0.20 | 0.25 |
| Chocolate | 0.11 | 0.19 | 0.18 |
All units are the median per 100 g (g). Biscuits, rice crackers and chocolate are higher in the newer survey, but the number of samples is small and this may be within the range of sample differences.
One more thing, Urayomi’s calculation. The FY2022-23 maximums were 1.3 for margarine, 0.86 for shortening and 1.5 for vegetable fats and oils (g/100 g). Margarine is at least 81% fat, so by calculation the maximum per 100 g of fat is 1.6 g. By this calculation, all of the 60 margarine, 12 shortening and 60 vegetable fat and oil samples fall within the “2 g or less per 100 g of fat” recommended by the EU and WHO. In FY2014-15 the maximums were 16 for margarine and 24 for shortening. Even in Japan, with no regulation, companies’ efforts have advanced and the numbers have dropped greatly (this includes differences in samples). However, analysis cannot distinguish natural from industrial sources. For fat spreads, we did not calculate because the combination with fat content is unknown.
Fried foods and frozen foods (FY2016)
In the FY2016 survey, about 70% of fried foods and about 90% of cooked frozen foods were under 0.3 g/100 g, the level at which “0 g” may be written.
| Item | Trans fat (median, g/100 g) | Weight of one piece or serving |
|---|---|---|
| Croquettes | 0.27 | 70–102 g (one piece) |
| Tempura | 0.23 | 94–286 g |
| Pork cutlet / minced meat cutlet | 0.22 | 73–196 g |
| Fried seafood | 0.16 | 36–178 g |
| French fries | 0.15 | 71–223 g (one package) |
| Fried chicken / nuggets | 0.15 | 83–122 g |
| Frozen pizza | 0.14 | 100–270 g (one pizza) |
| Frozen gyoza | 0.07 | 13–70 g |
Salad oil has some too, because of the deodorizing step
It may be surprising, but ordinary salad oil also contains trans fat. Even without hydrogenation, when vegetable oil is refined, some of the cis forms change to trans forms in the “deodorizing” step that removes smell (high temperature, vacuum). The MHLW Q&A also writes that it is “produced in the process of deodorizing vegetable oil at high temperature.”
These are values published by oil makers (per 100 g).
| Type of oil | Trans fat (g/100 g) | Published by and when |
|---|---|---|
| Salad oil | 1.2 | Nisshin OilliO (April 2023), J-Oil Mills (analyzed March 2024) |
| Canola oil | 0.8 | Nisshin OilliO, J-Oil Mills |
| Sesame fragrant oil | 0.6 | Nisshin OilliO |
| Rice bran oil | 0.3 | Nisshin OilliO |
| Flaxseed oil | 0.3 | Nisshin OilliO |
| Safflower oil | under 0.1 | Nisshin OilliO |
| Extra virgin olive oil | under 0.1 | Nisshin OilliO, J-Oil Mills |
In MAFF’s survey too, the median for the 60 vegetable fat and oil samples is 0.64 g/100 g (range 0.17–1.5), consistent with the makers’ values.
Urayomi’s calculation: salad oil (1.2 g/100 g) has more than today’s margarine (0.65 g/100 g) per 100 g. Because oil is used in small amounts, 10 g of it gives 0.12 g. Spreading 10 g of margarine gives 0.065 g. There is trans fat outside the “trans fat = margarine” picture. However, the 1.2% in salad oil falls within the EU and WHO “2% or less of fat.” Nisshin OilliO explains that, although there is no legal standard or content regulation in Japan, it manages to the Danish standard (up to 2% of fat) as a target (company explanation).
“Which oil is good” is not decided by trans fat amount alone. The fatty acid composition (saturated, monounsaturated, polyunsaturated) and resistance to heat also matter. That is summarized in the article on vegetable and animal oils. Here, for those who want to choose oils with a small published trans fat value, we give examples with a published value under 0.1 g.
How much do people in Japan eat?
There are three estimates, and they disagree
For “what percent of energy is the Japanese average,” there are three estimates using different methods.
| Method | Average intake | Source |
|---|---|---|
| Multiply the content per food (FY2006 survey) by the amount eaten (National Health and Nutrition Survey, 2003–07) | 0.666 g/day (0.31% of energy). Median 0.544 g (0.27%) | FSCJ assessment (2012) |
| Buy and analyze actual whole meals (Total Diet Study, FY2005–07) | 0.92–0.96 g/day (0.44–0.47%) | MAFF |
| Back-calculate from the amount of processed fats and oils made in Japan (2006) | 1.3 g/day (0.6%). By the same method in 1998, 1.56 g/day (0.7%) | Assessment; the view of the Japan Margarine Industry Association (an industry body) is cited |
The Consumer Affairs Agency’s 2011 guideline writes that “average intake is about 0.6% of total energy,” the same level as the third value. All three are below the WHO target (under 1%, or 2.2 g for 2,000 kcal). However, the methods differ, and even the newest survey is based on content data more than 10 years old. We could not find a newer nationwide survey.
Behind the average: small children and the top 5%
The FSCJ assessment writes that intake tends to be higher the younger the age.
- Mean for all ages: men 0.30%, women 0.33%. Top 5% (95th percentile): men 0.70%, women 0.75%
- Boys aged 1–6 have a mean of 0.47% and a top 5% of 1.02%, exceeding the WHO target. For girls, the top 5% is 0.99%
- The top 1% (99th percentile) of men aged 1–29 and women aged 1–59 also exceeds 1%
- However, the assessment also writes that when limited to hardened oil and edible vegetable oil sources, even the 99th percentile does not exceed 1% (estimating with MAFF’s upper-limit values, it is exceeded for boys aged 1–14 and others)
Surveys that record meals also show what lies behind the average.
- Yamada et al. (2010): 225 people aged 30 and over recorded their meals for 16 days. The mean for both men and women was 1.7 g a day (0.7–0.8% of energy). 5.7% of men and 24.4% of women exceeded 1%, especially women aged 30–49 in urban areas
- Kawabata et al. (2010): 6-day records of 118 students (aged 18–26). 1.8% of men and 11.5% of women exceeded 1%. Intake of cookies, cakes and baked sweets correlated positively with trans fat intake
- Yamada et al. (2009): in a diet history survey of 1,136 female students at dietitian training schools (aged 18–22), the mean was 0.90% (77% from hardened oil). The population is not representative
All are observational studies (dietary surveys) with limited numbers and groups. “The Japanese average is low” and “some people exceed 1%” are both true.
What are people getting it from?
In MAFF’s Total Diet Study (FY2005–07), the daily intake by food group was as follows.
| Food group | Per day (g) | Share of total (Urayomi’s calculation) |
|---|---|---|
| Fats and oils | 0.185–0.195 | About 20% |
| Confectionery | 0.167–0.171 | About 18% |
| Seasonings and spices | 0.140–0.143 | About 15% |
| Dairy | 0.131–0.134 | About 14% |
| Cereals | 0.111–0.114 | About 12% |
| Meat | 0.106–0.113 | About 12% |
| Fish and shellfish | 0.053 | About 6% |
| Total | 0.918–0.962 | 100% |
Fats and oils (margarine and oil) are only one fifth. Fats and oils, seasonings (roux, mayonnaise, dressing) and confectionery together are only a little over half (about 53%). Dairy and meat (mostly natural sources) account for about a quarter. The numbers show that “quitting margarine does not eliminate trans fat.”
Compared with the world
| Country/region | When surveyed | Trans fat (% of total energy) |
|---|---|---|
| Japan | 2003–07 | 0.31 (FSCJ), 0.44–0.47 (MAFF) |
| Australia | 2011-12 | 0.6 |
| New Zealand | 2008-09 | 0.6 |
| European Union | 1995-96 (before regulation) | Men 0.5–2.1, women 0.8–1.9 |
| US | 1994-96 (before regulation) | 2.6 (2.0 from partially hydrogenated oils) |
| US | 2011-12 (before regulation) | 0.5 (partially hydrogenated oils only. Top 10% at 1.0) |
| Canada | 2008 (before regulation) | 1.42 |
| South Korea | (adults) | 0.064 |
| China | 2013 | Mean 0.16, 0.34 in large cities such as Beijing and Guangzhou |
The sources are MAFF’s summary. The years, subjects and methods of the surveys differ, and some figures are from before regulation, so this is not for ranking. Internationally, Japan falls among the “countries with low intake.” The Consumer Commission’s summary (2015) also lays out that Denmark’s 1.0% in 1996 fell to 0.6–0.7% in 2005, and that the UK’s 2.2% in 1986-87 fell to 1.0% in 2007.
What increased when trans fat was reduced?
To reduce trans fat, you need a substitute hard fat. The result changes depending on what you replace it with. This is the part where “trans fat = bad, reduce it and the problem is solved” does not suffice.
Comparing the FY2006 and FY2010 surveys (Food Safety Commission of Japan)
The FSCJ measured products in FY2006 and FY2010. Only 11 household-use products were re-measured by the same brand; commercial-use is a comparison of averages between different samples (the assessment writes that the commercial-use FY2006 samples have no product continuity).
| Item | Trans fat (g/100 g) | Saturated fat (g/100 g, reference value) |
|---|---|---|
| General-use margarine (6 samples) | Average 5.28 → 3.13 (about 41% lower) | Not stated |
| Fat spread (4 samples) | Average 2.48 → 2.01 (about 19% lower) | Not stated |
| Commercial-use margarine | Average down to under one tenth (about 1 in most samples) | 29.9 → 40.9 (1.4 times) |
| Commercial-use shortening | Average down to under one tenth (about 1 in most samples) | 23.9 → 45.4 (1.9 times) |
The assessment writes that brands that have not been reduced and brands with high concentrations remain, and that attention to the saturated fat that increased along with the reduction will also be needed in the future. The market share of the general-use samples was about 51% in total.
However, sources disagree. MAFF’s FY2022-23 survey writes that “a tendency for saturated fat to increase along with the reduction of trans fat was not confirmed.” Because the samples, years and the share of commercial-use differ, we write both. The FY2022-23 medians for saturated fat are 30 g for margarine, 20 g for fat spread and 46 g for shortening.
The same thing is happening around the world. In Denmark, in more than two thirds of products tested after regulation, trans fat had been replaced mainly with saturated fat (coconut oil and palm oil).
Comparing at the same 10 g
We lined up saturated fat and trans fat for a guide amount to spread on bread (10 g) (Urayomi’s calculation).
- Household margarine has 2.30 g of saturated fat and 0.065 g of trans fat
- Salted butter has 5.05 g of saturated fat (2.2 times that of margarine) and 0.19 g of trans fat (about 3 times; however, mostly natural sources, and the survey is from FY2006-07)
- Household shortening has 4.62 g of saturated fat. Its trans fat, 0.061 g, is about the same as margarine
“Which is worse for the body” cannot be decided by a single number. The result is that for trans fat alone, margarine has less, and for saturated fat alone, butter has more.
Comparing with saturated fat
There are parts of “which is worse, trans fat or saturated fat” that can be answered with numbers.
- Compared at the same amount of energy, the effect on the LDL/HDL ratio is about twice as large for trans fat as for saturated fat (pooled 60 trials). Saturated fat does not lower HDL, but trans fat does
- The Dietary Reference Intakes for Japanese (2025 edition) calculates with actual intakes. Average trans fat is 0.3% and saturated fat about 7%, so by (0.3×2)÷(7×1), the effect of trans fat comes to about one twelfth that of saturated fat
That is, the effect per gram is larger for trans fat, while by amount saturated fat is far greater. And the harm of saturated fat itself is being debated among researchers.
| Position | Content |
|---|---|
| American Heart Association advisory (2017) | In trials replacing saturated fat with polyunsaturated vegetable oil, cardiovascular disease fell by about 30%. Replacing with refined carbohydrates or sugar does not reduce it (with corrections) |
| Cochrane review (2020) | In 15 trials of 2 years or more reducing saturated fat, cardiovascular events fell 17%. No difference in all-cause death and cardiovascular death (the authors are WHO experts, with research funding from the WHO) |
| Chowdhury et al. (2014), de Souza et al. (2015) | No visible association between saturated fat and coronary heart disease (de Souza rated the certainty “very low”) |
| Astrup et al. (2020) | A rebuttal that the evidence does not support limiting saturated fat |
Choosing which oil is summarized in the article on vegetable and animal oils.
The result changes with what you replace it with
The analysis by Mozaffarian and Clarke (2009) showed that the effect changes depending on what 1% of trans fat is replaced with (estimates from trials and follow-up studies).
| Replaced with | Change in total cholesterol/HDL ratio (per 1%, pooled trials) | Coronary heart disease risk (when 2% is replaced, follow-up studies) |
|---|---|---|
| Saturated fat | 0.31 lower | 17% lower |
| Monounsaturated fat | 0.54 lower | 21% lower |
| Polyunsaturated fat | 0.67 lower | 24% lower |
In another estimate in the same analysis, replacing a partially hydrogenated oil with 35% trans fat, for 7.5% of energy, with butter gave a small reduction in coronary heart disease risk (11.9% in the trial-based estimate, 14.4% in the follow-up-study-based estimate), versus 16.0% (trials) for canola oil and 33.4% (follow-up) for soybean oil. This means that if the replacement stops at “trans to saturated,” the effect is small.
Should we go back to butter?
Some say, “then let’s go back to butter.” Looking at the research, it is not that simple.
- A soft margarine containing almost no trans fat lowered LDL more than butter (Tonstad et al., 2001: 77 people with high cholesterol, 23 days, 15% of total energy, LDL down 11%). However, the food company that developed the product was involved, and there is no record of funding
- There is a follow-up study that people who eat a lot of butter have more deaths (220,000 people in the US, up to 33 years, the highest butter group had 1.15 times all-cause death. Zhang et al., 2025). It is estimated that replacing 10 g/day of butter with vegetable oil lowers all-cause death by 17%. But this is an observational study
- A pooled analysis of 9 follow-up studies of butter (636,151 people) found, per 14 g/day (1 tablespoon), all-cause death 1.01 times, cardiovascular disease 1.00 times and diabetes 0.96 times, with associations small or neutral (Pimpin et al., 2016. No trials)
- There is also a US follow-up study that replacing 5 g/day of margarine, butter and the like with olive oil lowers cardiovascular disease risk by 5–7% (Guasch-Ferré et al., 2020)
We cannot say either “butter is safer” or “margarine is safer.” What we can tell is that the result changes with what you replace it with (butter, vegetable oil, olive oil and so on).
Little research on full hydrogenation and interesterification
Ways to harden without producing trans fat include full hydrogenation and interesterification (swapping the arrangement of fatty acids). Today’s margarine and shortening get their firmness through such methods (the ingredients and manufacturing of shortening are in the shortening article). Human trials number only about 25, and the main trials were conducted with funding from the palm oil industry body (the Malaysian Palm Oil Board, MPOB).
| Study | Participants and duration | Result | Funding and conflicts of interest |
|---|---|---|---|
| Sundram et al. (2007) | 30 healthy people, 4 weeks x 3 | An interesterified fat high in stearic acid raised the LDL/HDL ratio and fasting blood glucose, as partially hydrogenated soybean oil did (glucose about 20% higher) | MPOB funding. The first author is an MPOB employee |
| Ng et al. (2018) | 85 overweight people, 8 weeks | No difference in the index of insulin resistance | MPOB research funding |
| Hall et al. (2025) | 51 healthy people, 6 weeks x 2 | No difference in the total/HDL ratio between palmitic-type and stearic-type interesterified fats | MPOB research funding. A co-author is an employee of ADM |
| Mills et al. (2021) | Postprandial trial | Oils high in palmitic acid increased small LDL and the like, with or without interesterification. Interesterification itself does not change digestion | UK public funding. The test fats were provided by ADM |
| Hayes and Pronczuk (2010, review) | About 25 trials | At small amounts, “no abnormalities detectable.” Adverse effects in trials giving a lot of stearic-acid type. From 7–8% | The author Hayes was a member of the Palm Oil advisory council |
Trials at everyday amounts mostly show “no difference.” However, duration is 4–8 weeks, numbers are in the tens, and much of the funding is from industry. The accurate statement is neither “safety has been confirmed” nor “dangerous,” but “there is little research and long-term effects are not known.” Note that the increase in saturated fat in commercial-use margarine and shortening (the previous section) is a separate matter.
How to read labels and calculate it yourself
The rules for writing “0 g” differ by country
Is food labeled “trans fat 0 g” or “zero” really zero? In Japan, “0 g” may be written when the amount is under 0.3 g per 100 g (Consumer Affairs Agency guideline). This condition differs by country.
| Country/region | Conditions for writing “0 g” |
|---|---|
| Japan (guideline, voluntary) | Under 0.3 g per 100 g (100 ml) of food |
| US | Under 0.5 g per serving |
| Canada | A “free” claim requires under 0.2 g per serving and, for example, under 2 g combined with saturated fat |
| South Korea | Under 0.2 g per serving (under 2 g per 100 g for edible fats and oils) |
| Taiwan | Per 100 g of solid, total fat 1.0 g or less, or trans fat 0.3 g or less |
| China | 0.3 g or less per 100 g of solid (100 ml of liquid) |
| Hong Kong | A “does not contain” claim requires 0.3 g or less per 100 g of solid, among other conditions |
Let us apply each country’s conditions to the same 10 g of margarine (using the FY2022-23 median, 0.65 g per 100 g, 0.065 g per serving) (Urayomi’s calculation. The “0” in nutrition facts and a “free” claim are separate rules, so check the actual operation in each country).
- US and South Korea: judged per serving, so this is at a level where “0 g” may be written
- Japan, Taiwan, China and Hong Kong: judged per 100 g, so 0.65 g exceeds 0.3 g and cannot be written
- Canada’s “free”: there is about 3 g of saturated fat per serving, so the conditions are not met
In other words, the same item may or may not become “0 g,” depending on the country. “0 g” is not a measured zero but that country’s rounding-down rule.
There is a real example. The nutrition facts for 27 of Seven-Eleven’s main breads all say “trans fat 0 g” (as of December 22, 2025). The stated reason is the guideline’s operation: “under 0.3 g per 100 g of product is shown as 0 g.” On the other hand, in MAFF’s survey, the croissant median was 0.20 g/100 g, with a range of 0.12–2.3. This means that even when “0 g” is written, up to 0.29 g per 100 g may be present.
Company disclosure varies
| Company | Form of disclosure | Content (official sites) |
|---|---|---|
| Meiji, Snow Brand Megmilk, Sokensha | Per product, value per 10 g | 0.05–0.1 g per 10 g in main household margarines (published 2018–2021). Two Sokensha products about 0.03 g |
| Seven-Eleven, Yamazaki Baking | “0 g” only in nutrition facts | Under 0.3 g per 100 g is treated as 0 g |
| Mister Donut | Average value | Average per doughnut, pie or muffin went from about 1.44 g to about 0.25 g (2007 changeover, calculated value). The average of all items handled as of April 1, 2026 is about 0.25 g |
| McDonald’s Japan | No numerical value found within what we could check | Explains that it changed the specification of the frying oil in 2007 |
| Lawson, FamilyMart | Could not confirm this time | ― |
The contents of “食用精製加工油脂” and “加工油脂” cannot be read from the label
The ingredients of margarine are written as “食用植物油脂” (edible vegetable fats and oils) and “食用精製加工油脂” (edible refined processed fats and oils). According to Snow Brand Megmilk’s explanation, “食用精製加工油脂” includes fats processed by hydrogenation, fractionation or interesterification. Trans fat forms in the process of making partially hydrogenated fats. The “食用精製加工油脂” on a label alone does not tell which processing was used.
- For ingredient labeling, group names such as “植物油脂” (vegetable fats and oils) and “加工油脂” (processed fats and oils) are acceptable, and the content of processed fats (hydrogenation or interesterification) need not be written (Food Labeling Standards; details in the vegetable fats and oils article). The JAS for commercial-use edible refined processed fats is a standard that requires writing “(硬化油)” (hardened oil), “(分別油)” (fractionated oil) or “(エステル交換油)” (interesterified oil), but this does not necessarily reach consumers’ eyes
- Statements such as “部分水素添加油脂不使用” (no partially hydrogenated oils used) and “トランス脂肪酸の低減に取り組んでいます” (we are working to reduce trans fat) are the company’s voluntary labeling. The way of thinking about “〇〇不使用” (“not used”) claims is in the article on “additive-free” labeling rules
- “Emulsifiers” in margarine ingredients are summarized in the emulsifiers article
The European Union requires that when hydrogenated fats are used, the ingredient list state whether they are “fully” or “partially” hydrogenated. Japan has no such rule.
The composition tables do not tell you
The fatty acid tables of the Standard Tables of Food Composition in Japan (8th revision) have no trans fat column. Nutrient calculation using the composition tables cannot calculate trans fat. The only ways to find the value are the tables from MAFF and Food Safety Commission surveys, and values published by manufacturers.
Calculating it yourself
The formula is just this:
Content (g/100 g) × amount eaten (g) ÷ 100 = trans fat eaten (g)
From MAFF’s FY2022-23 medians (per 100 g) and the guide amount per serving (the range in MAFF’s FY2014-15 table), we calculated the amount per serving. Taking the WHO target as 2.2 g a day for a 2,000 kcal person, we also give the percentage.
| Food | Median (g/100 g) | Amount per serving (g) | Per serving (g) | Share of 2.2 g |
|---|---|---|---|---|
| Margarine (one spreading on bread) | 0.65 | 8–10 | 0.052–0.065 | 2.3–2.9% |
| Loaf bread (one slice from a 6-slice loaf) | 0.03 | 56–69 | 0.017–0.021 | 0.8–0.9% |
| Croissant (one) | 0.20 | 27–57 | 0.054–0.114 | 2.4–5.1% |
| Doughnut (one) | 0.16 | 34–111 | 0.054–0.178 | 2.4–8.0% |
| Shortcake (one slice) | 0.12 | 70–143 | 0.084–0.172 | 3.8–7.7% |
| Apple pie etc. (one piece or slice) | 0.13 | 79–181 | 0.103–0.235 | 4.6–10.6% |
| Curry roux (for one plate) | 0.46 | 18–34 | 0.083–0.156 | 3.7–7.0% |
| Mayonnaise (one serving) | 0.39 | 15 | 0.059 | 2.6% |
| Instant noodles (one meal) | 0.10 | 71–160 | 0.071–0.160 | 3.2–7.2% |
Three things can be said from this table:
- One slice of loaf bread with 10 g of margarine is about 0.08 g (0.02 g from the bread plus 0.065 g from the margarine). That is about 4% of the WHO’s 2.2 g
- To reach the WHO target of 2.2 g would take about 340 g of today’s margarine, or about 26 g of margarine at the FY2006-07 median (8.7 g/100 g). For the same 10 g, old margarine would be 0.87 g and today’s 0.065 g, about 93% less (the survey samples differ, so this is not a simple decrease)
- Adding up, with this table’s values, a day with bread and margarine, curry, one doughnut, 10 g of salad oil and one croquette gives about 0.5–0.8 g (natural portions from milk, meat, fish and so on are not included. This is an example of Urayomi’s calculation). That is about 20–40% of 2.2 g
The names of fats in the ingredient list (vegetable fats and oils, processed fats and oils, etc.) do not reveal what is inside. If you are concerned, look for whether the nutrition facts have a trans fat column, and if so check the amount (remembering that even with “0 g,” up to under 0.3 g per 100 g may be present).
Checking 78 foods featured on Urayomi
We counted the ingredient lists of the 78 foods Urayomi has featured (October 3, 2026).
| Ingredient labeling | Foods that apply |
|---|---|
| Margarine, shortening, fat spread, hardened oil | 0 foods |
| “加工油脂” (edible processed fats and oils) | 2 foods (consommé, corn cream cup soup) |
| “植物油脂” (vegetable fats and oils) | 9 foods (stew mix, mayonnaise, dressing, roux, Chinese soup base, abura soba and others) |
| “食用油脂” (edible fats and oils; a group name) | 8 foods (7 curry roux and 1 powdered milk) |
| Blended fat of palm oil and rapeseed oil | 1 food (S&B Golden Curry) |
There are 20 foods in total with fat labeling. Of these, 5 use beef tallow or lard. Not a single food listed margarine or shortening. However, the contents of the “植物油脂” and “加工油脂” in roux and soup bases cannot be told from the back label. Even when “加工油脂” is written, it is not necessarily hydrogenation; it may be interesterification or fractionation. Trans fat in roux is summarized in the curry roux article.
Items featured in this article (summary)
Here are the items featured in the article, gathered once more. Reasons and ingredients are written in each section.
| Item featured | Where to buy |
|---|---|
| 日清オイリオ BOSCO エキストラバージンオリーブオイル 228g (Nisshin OilliO BOSCO Extra Virgin Olive Oil, 228 g) | See on Rakuten (楽天24) PR See on Amazon.co.jp PR |
Summary
| What you want to know | What we found |
|---|---|
| How was it discovered? | A by-product of hydrogenation, which hardens liquid oil (1901 experiment, Crisco launched in 1911). As of 1920, even chemists did not recognize that trans forms were being made. A 1990 trial showed LDL up and HDL down |
| Is it bad for you? | What is solid is LDL up and HDL down (trials) and an association with coronary heart disease (follow-up studies, a range of 1.16 to 1.93 times). No study has tested heart disease in a trial. For cancer, dementia, infertility and so on, observational studies dominate, and causation cannot be stated |
| What about natural sources? | Interpretation is split among researchers. The WHO does not distinguish, but because intake is small, associations are hard to see in follow-up studies |
| What about global regulation? | At the end of 2023, 53 countries (46% of the population) had implemented it. Either a limit of 2 g per 100 g of fat, or a ban on partially hydrogenated oils. The US decision is not a ban on “trans fat” but an exclusion of partially hydrogenated oils |
| Why doesn’t Japan regulate it? | Because average intake is under 1% of energy (0.3–0.6%). The government says it will consider regulation or mandatory labeling if an upward trend appears. The WHO lists Japan as one of 8 countries that could greatly reduce the global burden by moving |
| Which foods are high? | In MAFF’s FY2022-23 survey, medians were 1.0 for dairy-based foods, 0.65 for margarine and 0.61 for shortening. Salad oil is 1.2 g/100 g. Margarine fell from 8.7 to 0.65 (note how the surveys compare) |
| How much do people in Japan eat? | The average of 0.3–0.6% is below the target of under 1%, but the top 5% of boys aged 1–6 is 1.02%. In food records, 24% of women aged 30 and over exceeded 1% |
| What about what was reduced? | Saturated fat rose 1.4–1.9 times in commercial-use margarine and shortening (FY2006 → FY2010). However, MAFF’s FY2022-23 survey says “a tendency to increase was not confirmed.” Going back to butter is not the answer either |
| What about “0 g”? | In Japan, under 0.3 g per 100 g; in the US, under 0.5 g per serving. The same food may or may not be allowed to say “0 g,” depending on the country |
Sources
History and mechanism
- Normann W.’s hydrogenation patent (British patent GB190301515) https://patents.google.com/patent/GB190301515A/en, AOCS “Wilhelm Normann” and “The Battle Over Hydrogenation 1903-1920”
- Berlin Mills v. P&G, 254 U.S. 156 (US Supreme Court, 1920)
- US Department of Agriculture Economic Research Service (ERS) “Butter and margarine availability over the last century” (2016)
- Catalysis Society Senior Forum News No. 77 (2015), Industrial Catalysis Study Group News No. 73 (2012)
- MAFF “How trans fatty acids are formed” and “Efforts to reduce trans fatty acids”
- US FDA “Final Determination Regarding Partially Hydrogenated Oils” Federal Register, June 17, 2015 (80 FR 34650)
- Petition from CSPI (a US consumer group) (source of the citations of the FASEB report and FDA judgment). This is an organization’s document, and we have not checked the cited originals
Effects on the body
- Mensink RP, Katan MB. N Engl J Med 1990 (PMID 2374566) / Mensink RP, et al. Am J Clin Nutr 2003 (PMID 12716665) / Aronis KN, et al. Am J Clin Nutr 2012 (PMID 23053553)
- Willett WC, et al. Lancet 1993 (PMID 8094827) / Hu FB, et al. N Engl J Med 1997 (PMID 9366580) / Oh K, et al. Am J Epidemiol 2005 (PMID 15781956) / Chowdhury R, et al. Ann Intern Med 2014 (PMID 24723079) / de Souza RJ, et al. BMJ 2015 (PMID 26268692) / Bendsen NT, et al. Eur J Clin Nutr 2011 (PMID 21427742)
- Brouwer IA, et al. PLoS One 2010 (PMID 20209147) / Chardigny JM, et al. Am J Clin Nutr 2008 (PMID 18326592) / Gayet-Boyer C, et al. Br J Nutr 2014 (PMID 25345440) / Gebauer SK, et al. Adv Nutr 2011 (PMID 22332075)
- Wang Q, et al. J Am Heart Assoc 2016 (PMID 26790695) / Restrepo BJ, Rieger M. Am J Prev Med 2016 (PMID 26319518) / Brandt EJ, et al. JAMA Cardiol 2017 (PMID 28403435) / Stender S, et al. BMJ Open 2016 (PMID 26975938)
- Honda T, et al. Neurology 2019 (PMID 31645469) / Morris MC, et al. Arch Neurol 2003 (PMID 12580703) / Nwaru BI, et al. Food Nutr Res 2022 (PMID 35950105) / Chavarro JE, et al. Am J Clin Nutr 2007 (PMID 17209201) / Sánchez-Villegas A, et al. PLoS One 2011 (PMID 21298116) / Michels N, et al. Nutr Rev 2021 (PMID 34104953)
- Mozaffarian D, Clarke R. Eur J Clin Nutr 2009 (PMID 19424216) / Tonstad S, et al. Nutr Metab Cardiovasc Dis 2001 (PMID 11887429) / Pimpin L, et al. PLoS One 2016 (PMID 27355649) / Zhang Y, et al. JAMA Intern Med 2025 (PMID 40048719) / Guasch-Ferré M, et al. J Am Coll Cardiol 2020 (PMID 32147453)
- Sundram K, et al. Nutr Metab 2007 (PMID 17224066) / Ng et al. Nutrients 2018 (PMID 30126103) / Hall et al. Am J Clin Nutr 2025 (PMID 40975239) / Mills et al. Am J Clin Nutr 2021 (PMID 33675343) / Hayes KC, Pronczuk A. J Am Coll Nutr 2010 (PMID 20823487)
- Sacks FM, et al. AHA Presidential Advisory. Circulation 2017 (PMID 28620111) / Hooper L, et al. Cochrane 2020 (PMID 32827219) / Astrup A, et al. J Am Coll Cardiol 2020 (PMID 32562735) / Takeuchi H, Sugano M. J Lipids 2017 (PMID 28951788)
- WHO “Saturated fatty acid and trans-fatty acid intake for adults and children: WHO guideline” (2023) https://www.who.int/publications/i/item/9789240073630
Japanese assessments, regulation, content and intake
- Food Safety Commission of Japan, “Trans Fatty Acids Contained in Food” assessment (March 2012), and the Q&A on the assessment https://www.fsc.go.jp/sonota/trans_fat/iinkai422_trans-sibosan_hyoka.pdf
- MHLW “Dietary Reference Intakes for Japanese (2025 edition)” on lipids, and the ministry’s trans fatty acid Q&A
- Consumer Affairs Agency “Guideline on Disclosure of Information on Trans Fatty Acids” (February 21, 2011), “Awareness and Dissemination of Disclosure of Trans Fatty Acid Information” (June 26, 2020) and the survey of businesses
- Consumer Commission, Food Labeling Subcommittee, Food Working Group, “Summary on Trans Fatty Acids” (May 2015)
- Food Labeling Standards (Cabinet Office Order No. 10 of 2015, e-Gov Law Search)
- MAFF “Survey of Trans Fatty Acid Content in Foods” FY2006-07, FY2014-15, FY2016 and FY2022-23; “Intake of trans fatty acids”; “Overseas regulation” (country pages); “WHO initiatives”
- MEXT “Standard Tables of Food Composition in Japan (8th revision), 2023 supplement,” Fatty Acid Tables
- Japan Margarine Industry Association production statistics and material on raw material usage (2016–2025)
- Official sites of Meiji, Snow Brand Megmilk, Sokensha, J-Oil Mills, Nisshin OilliO, Seven-Eleven, Yamazaki Baking and Duskin (Mister Donut) (checked October 3, 2026)
Regulation worldwide
- WHO “Trans fat” fact sheet (January 24, 2024), “Countdown to 2023” report, WHO announcements (January 29, 2024 and May 19, 2025)
- Regulation (EU) 2019/649 (EUR-Lex), Health Canada notice (2017), FSSAI press release (February 2021), and for each country’s regulation, MAFF’s country pages
How we looked at interest
- Google search suggestions (collected October 3, 2026: 2,031 terms in Japanese and 3,176 in English; classified and tallied by Urayomi). This looks at the range of questions people actually type, not the number of searches
- Wikimedia pageview API (annual views of the Japanese and English versions)
Related articles and databases
- Is Margarine Bad for You? History, How It's Made, How It Differs from Butter and Fat Spread, and Checking the “Plastic,” “Only in Japan” and “Banned Abroad” Claims
- What Is Shortening? History, Ingredients, How It's Made, Whether “Bad for You” and “Carcinogenic” Claims Hold Up, Why Bread and Sweets Use It, and Alternative Fats
- Are Lard and Butter Bad for You? 16 Plant Oils and Animal Fats (Beef Tallow, Fish Oil) Compared by Fatty Acids, and Which to Use Every Day
- What Is “植物油脂” (Vegetable Fat)? How True Is “Vegetable Oils Are Bad for You,” and What the Back Label Does and Does Not Tell You
- Does Eating Too Much Oil Cause Dementia or Depression? What Studies Show
- Comparing Store-Bought Curry Roux by the Label: From Meiji-Era Cookbooks to Solid Roux, Fat, Salt and Additives in 11 Products, Lead in Turmeric, and Food Poisoning from Leftover Curry
- Are emulsifiers bad for you? The history that began with egg yolk lecithin, types and uses, gut microbiota research (mice and humans), and how Japan and the EU label them